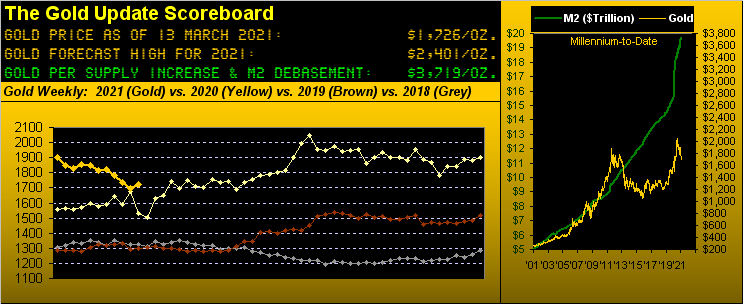
Said title might also be phrased as "Hire Gold from Here" (i.e. put Gold to work for you) or perhaps editorially construed as being "in our opinion" per the word "Here" rather than being specifically from the price of Gold at 1726 where it settled yesterday (Friday).
But regardless your permutation interpretation, Gold has run a corrective course, checked the salient boxes therein, and has thus passed muster to resume its upside luster.
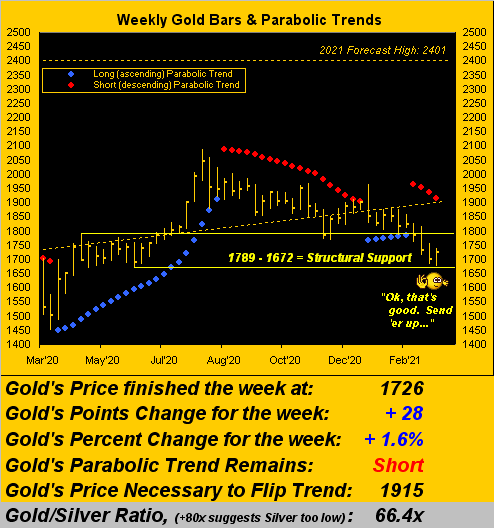
In fact this past Monday with price having traded down to 1673—practically the precise low of the 1789-1672 structural support zone—as the year unfolds we may find that 1673 level to be Gold's 2021 low. Box checking, indeed. Check 'em out:
■ Confirmed come 19 February, Gold's weekly parabolic trend flipped to Short (price then at 1783); thus price went down as we expected 'twould —"Check!"
■ How far down ought be down? We cited the 1789-1672 structural support zone, which as just noted has now been essentially traced in full— "Check!"
■ The technical trading community then kicked into gear, Gold from 1673 leaping $65/oz. (+3.9%) in just 60 trading hours (2 1/2 trading days) to 1738—"Check!"
■ Gold completed a full reversion to (with some undershoot too) its mean of the stalwart supportive 300-day moving average (today 1785 and rising)—"Check!"
■ President Biden just signed $1.9 trillion worth of faux dough into the system, the StateSide legislature pulling together an additional $2 trillion "starter" bill to turn everyone green, (which shall be the case when they can't afford anything)—"Check!"
■ Nine years ago almost to the day (26 March 2012) the U.S. Money Supply (by "M2") was half what 'tis today; Gold then was 1689—"Check!"
■ Got Gold?—"Check!"
Now check out Gold's noted weekly bars from one year ago-to-date. The "flip-to-Long" level is 1915, which is 189 points above the present 1726 price: Gold's expected weekly trading range is now 72 points. Within that vacuum—should Gold have just bottomed—we might expect to see the parabolic red Short dots flip to blue Long dots in three weeks' time. Might seem a bit of a stretch, but as you know when Gold goes, it GOES!
Moreover, at Friday's conclusion of trading, our end-of-day BEGOS Markets signal table popped up as follows:
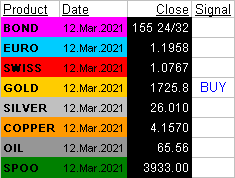
And as you seasoned watchers of the site know, a "BUY" signal in this case is generated when our "Baby Blues" of linear regression trend consistency move above their -80% axis as next shown on the left across the last three months-to-date of Gold's daily bars:
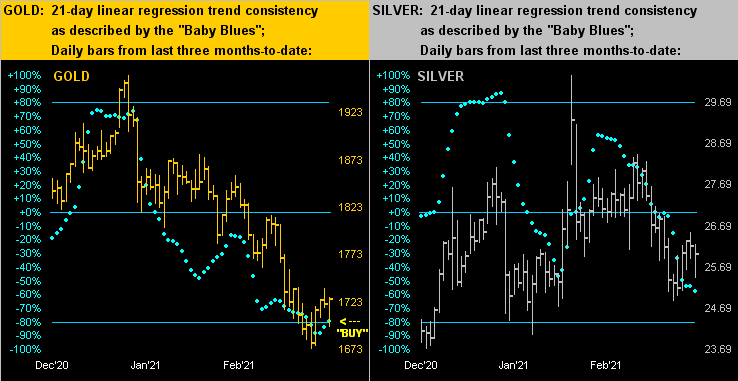
Whereas on the right, the "Baby Blues" for Silver hardly are encouraging a wit, albeit her price has not deteriorated at Gold's pace. In fact, from the leftmost closing price (10 December) on both panels, Gold today is -6.2% lower whereas Silver is 7.8% higher. 'Course those three months back the Gold/Silver ratio was still a well-out-of-whack 76x; but since then, Silver has duly been catching up to Gold. That ratio today is 66x, smack on the millennium-to-date average ratio of 66x. So with these two precious metals finally in pricing sync, they can now rightly rise together, we think.
Which by the way given the "We Never Go Down Dept." begs this question: Has the S&P 500 crashed yet? Again, we're just askin'...
"No way, mmb..."
A facetiously flippant reply with a wink of the eye from Squire our guy. Further, the S&P (3943) is at an all-time high. (Yes, 'tis gone beyond all we were taught, beyond sustainability, beyond money management responsibility and beyond ridiculous). Indeed, let's run another checklist:
■ The S&P's present 3943 level is not far from what Gold ought be (see the opening Scoreboard)—"Check!"
■ Gold's 1726 ought instead be the S&P's fix, our "live" price/earnings ratio for the Index at 74.6x—"Check!"
■ Yields: S&P 1.458%; US 10-year Note 1.635%; US 30-year Bond 2.402%—"Check!"
■ Scarier still: We know, and you know, that Federal Reserve Chairman Powell, his Fed Presidents and FOMC all know, the stock market is horribly due for a massive blow. And the key unmentionable in the fertile minds of every one of them is exactly what Stephen Stills admitted to the masses at Woodstock pre-dawn on 18 August 1969: "We're scared s**tless." And the FedFolk cannot prevent it. —"Check!"
In fact, a very valued and successful trading colleague of ours (and you know who you are out there) is accumulating put option "LEAPS" (Long Term Equity Anticipation Security) on the S&P with strike prices below 2000. Yeah, that's for a 50% correction. Just like the DotComBomb (2000-2002) and the GlobalFinFlop (2008-2009). Next crash in line: "Look Ma! No Earnings!" And if it didn't sink in with you a week ago: of the 505 S&P 500 constituents—at this writing based on "trailing 12-months earnings"—83 of 'em (that's 16% of the Index) ain't got none.
But who cares, right? Rather, let us all rejoice in all the great economic growth (already overly "priced in," but we're not supposed to say that) coming our way. To wit, our Economic Barometer:
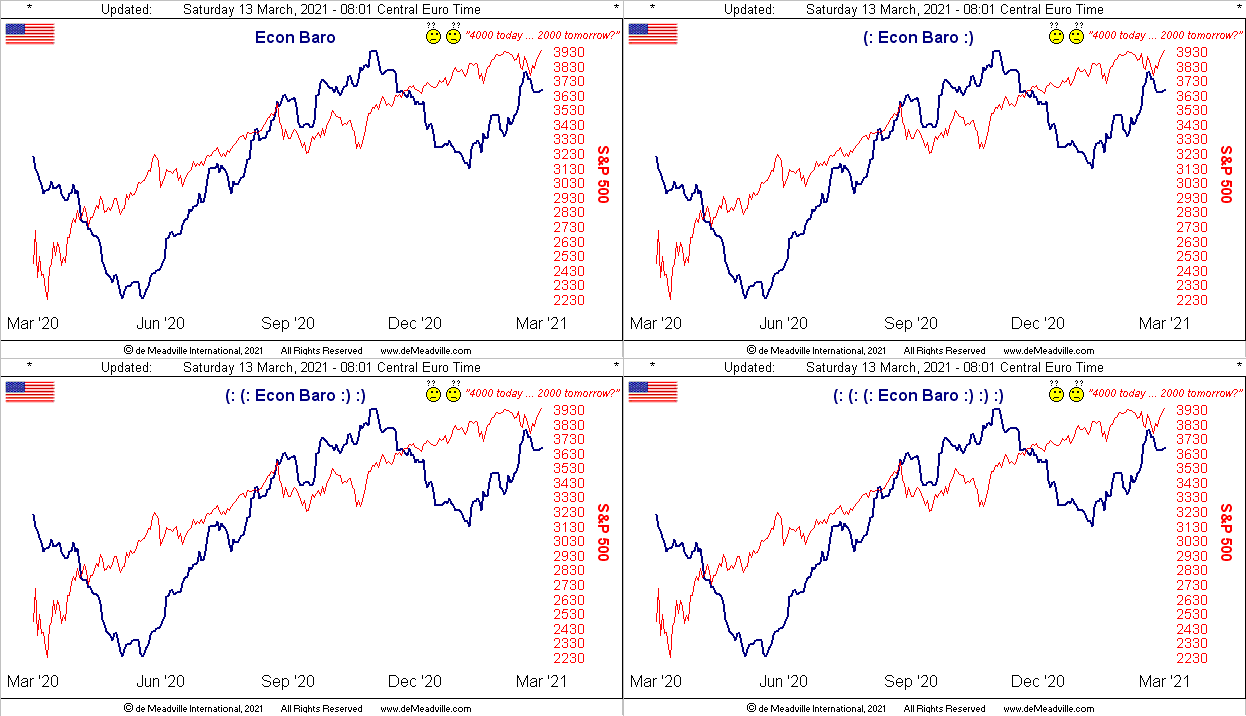
And this past week's big Baro highlight? The University of Michigan Sentiment Survey leapt from 76.8 in February to 83.0 for March: that is the seventh-largest leap for such reading in better than a decade. "Everybody's happy!"
Meanwhile, February's inflation readings were rather benign; (we'll see how long that lasts as the month's Treasury Budget blew up); but its new Secretary "Old Yeller" opined that stimulus likely shan't be problematic as regards inflation. Ok, thanks. As for January's Wholesale Inventories, they backed up, (uh-oh, but mum's the word, Mum...).
Adding to the parade of great news, the Fed just said that the net worth of U.S. households reached a record $130 trillion in Q4. (Better get those stimulus checks out a.s.a.p.)
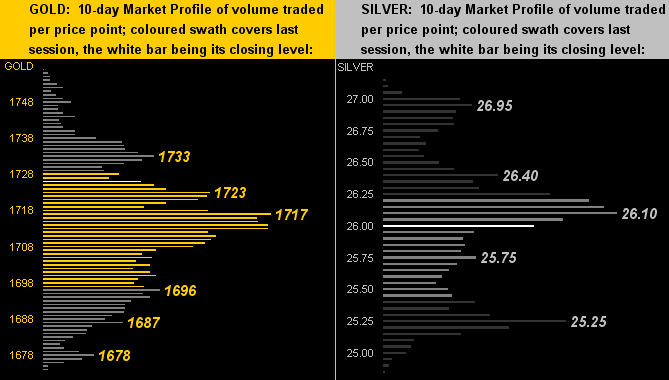
If anything ought be done a.s.a.p. 'tis ensuring one has exposure to Gold, and Silver too! Here (below left) is Gold's 10-day Market Profile along with that for Sister Silver (below right). The yellow metal's denoted 1717 apex appears as a nice platform from which to launch; that for the white metal requires price first getting back above her denoted 26.10 apex:
All-in-all, here's the present state of The Gold Stack:
The Gold Stack
- Gold's Value per Dollar Debasement, (from our opening "Scoreboard"): 3719
- Gold’s All-Time Intra-Day High: 2089 (07 August 2020)
- Gold’s All-Time Closing High: 2075 (06 August 2020)
- 2021's High: 1963 (06 January)
- The Weekly Parabolic Price to flip Long: 1915
- The Gateway to 2000: 1900+
- The Final Frontier: 1800-1900
- The Northern Front: 1800-1750
- The 300-Day Moving Average: 1785 and rising
- On Maneuvers: 1750-1579
- Trading Resistance: 1733
- Gold Currently: 1726, (expected daily trading range ["EDTR"]: 33 points)
- Trading Support: 1723 / 1717 / 1696 / 1687 / 1678; (structural support: 1789 to 1672)
- 10-Session “volume-weighted” average price magnet: 1713
- 10-Session directional range: down to 1673 (from 1757) = -84 points or -4.8%
- 2021's Low: 1673 (08 March)
- The Floor: 1579-1466
- Le Sous-sol: Sub-1466
- The Support Shelf: 1454-1434
- Base Camp: 1377
- The 1360s Double-Top: 1369 in Apr '18 preceded by 1362 in Sep '17
- Neverland: The Whiny 1290s
- The Box: 1280-1240
We'll wrap it here with this FinMedia confusion, courtesy of Dow Jones Newswires:
"U.S. Set to Power Global Economic Recovery From COVID-19 For the first time since 2005, the U.S. is expected to make a bigger contribution to global economic growth than China, say economists."
Ummm ... did we not very recently read that China is only just now passing the U.S? Or was that by gross domestic product rather than by global economic growth contribution? Regardless, just make sure on your contributory checklist that you'll benefit by higher Gold from here!
Cheers!