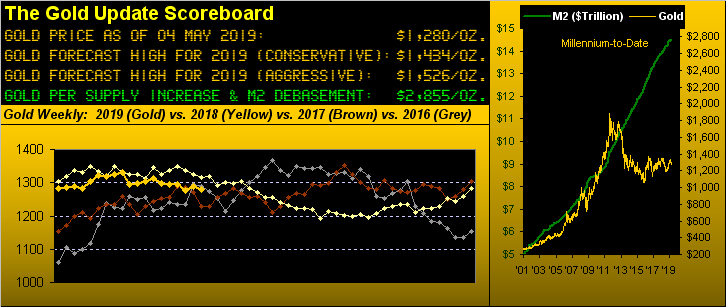
For 2019, four months (plus three trading days in May) are in the books. And the wallflower at this year's Dance of the Markets so far is Gold, essentially "unch" from where it finished 2018 (at 1285), settling out the week yesterday (Friday) at 1280.
Indeed year-to-date, comparably lifeless is our Gold. From 2001 onward, the average trading range for the price of Gold through the first four calendar months of each year is 16.4% (low price to high price). Last year was the narrowest for this period, just 5.0%. Second narrowest? This year: 'twas just 6.5%. Gold has been shelved, today sitting precisely atop The Box (1280-1240) whilst for the balance of the herd 'tis nothing but stocks.
There are exceptions, however. A fine friend ensconced at the foot of the French Alps in the department of Isère wrote to us yesterday, stating "...As you see I try to avoid the US market. I think it is overvalued today..." Our reply: "...'Overvalued': your understatement is hilarious!!..."
To wit: permanently parked in our garage of market facts is the historical one that the S&P 500 always regresses (either up or down) to a reasonable price/earnings ratio, typically in the teens, (our live" reading at this writing being 31.2x). That means earnings need double to support the current Index level of 2945. Are they? Hardly. With 362 of the S&P's components having reported their Q1 earnings, 62% are better than the same period a year ago. BUT: is the average increase the necessary +100% to get the p/e in line? No. Specific to Q1, 'tis less than +1%. Have a nice day.
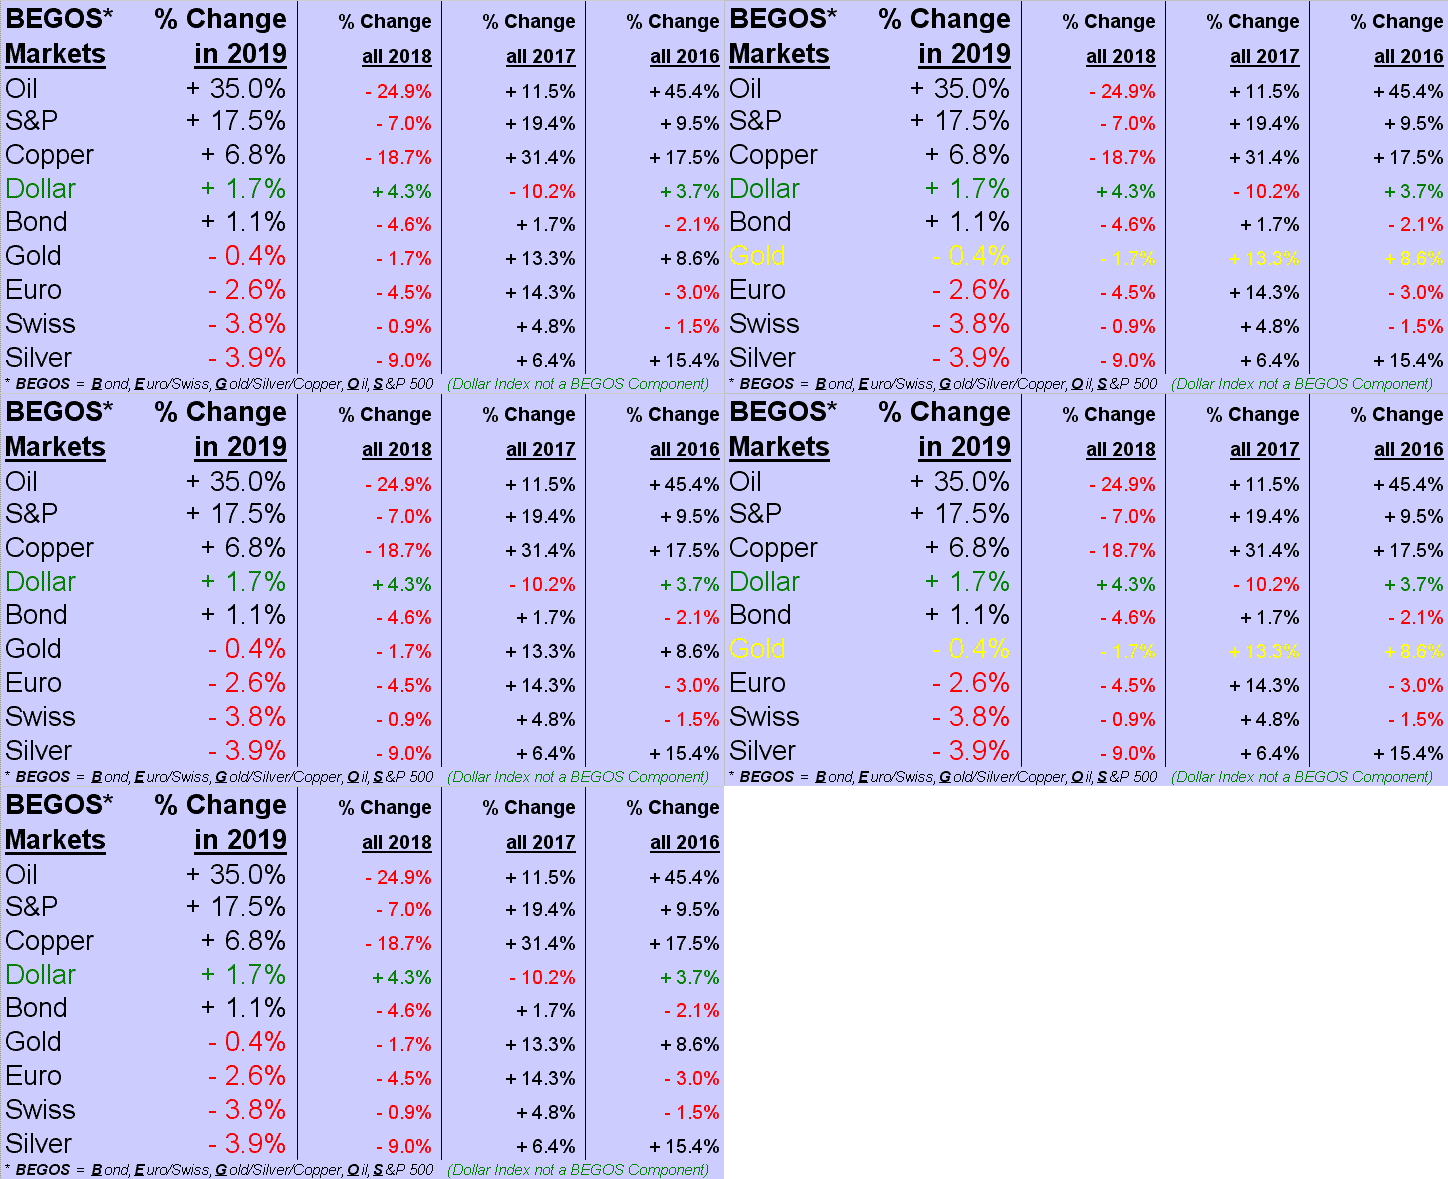
Still, so far in 2019 whilst Gold sits in the dance hall corner commiserating with other contra-Dollar components, the life of the party remains Oil +35.0%, followed by the S&P +17.5%. Here's the full slate of the BEGOS Markets year-to-date (though 03 May), which sadly for Sister Silver ain't at all great:
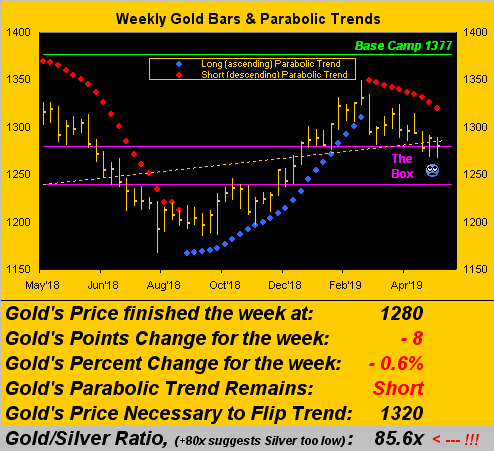
As to Gold itself, turning to the weekly bars we find the red dots of parabolic Short trend now 10 weeks in duration. But the downside tilt continues to be comparatively shallow given the purple-bounded, supportive protection of The Box:
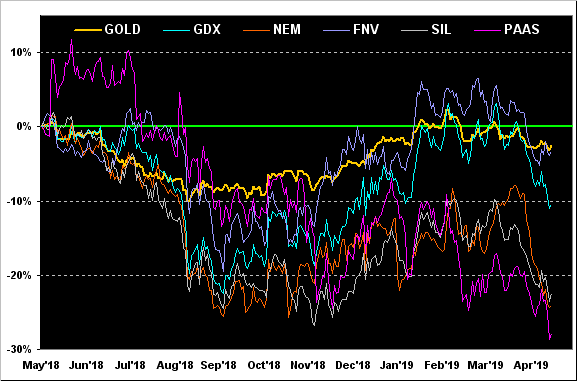
Further, it being month's end plus three May days, let's pull up (or perhaps better-stated pull down) our year-over-year percentage tracks for Gold and several of the highly-visible precious metals equities. From least worst to the worst we find Gold itself -2% vis-à-vis this date a year ago, Franco-Nevada Corporation (NYSE:FNV) -3%; the VanEck Vectors Gold Miners exchange-traded fund GDX (NYSE:GDX) -10%; the Global X Silver Miners (NYSE:SIL) -22%; Newmont Mining (NYSE:NEM) -24%; and Pan American Silver Corp (NASDAQ:PAAS) -28%. Poor ole PAAS! But from our "Fun With Figures Dept." -- and to be sure the Gold/Silver ratio remains a historically-high 85.6x -- since PAAS' shares went public in 1995, the average Gold/PAAS ratio is 62x. PAAS today is 12 bucks/share: were Gold to reach our conservative forecast high for this year of 1434 and (this is a stretch) those ratios regress to average, we'd find PAAS having nearly doubled to 23. Oh the vacuum of the perfect world, eh? Here are the tracks:
Query: for the precious metals to right themselves, must we have a stock market demise? Not really. The inevitable catch-up to currency debasement shall be the ultimate Golden prize, notably padded by the overshoot such as we saw in 2011, during which intra-year the S&P did suffer a 16% setback before then zooming off nearly correction-less into 2015. In fact, this past autumn saw a full 20% S&P correction, somewhat short (pun intended) of our call for a 27% drop to 2154 (which remains on the table).
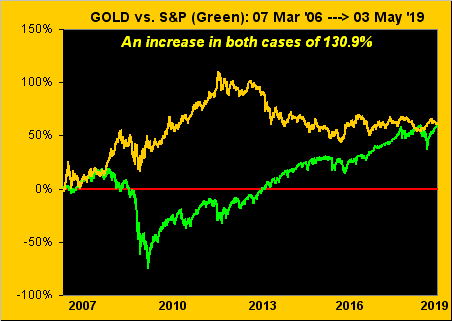
But is it a myth that Gold and the S&P are inversely correlated? It depends as to how one views it. Better than 13 years ago on 07 March 2006 Gold settled at 554.5 and the S&P at 1275.88. Today Gold at 1280.2 is 130.9% higher ... as identically is the S&P at 2945.64 ... so with all due respect, Bob Frost, even having taken the road less traveled by hasn't made any difference, (S&P dividends aside, 'natch):
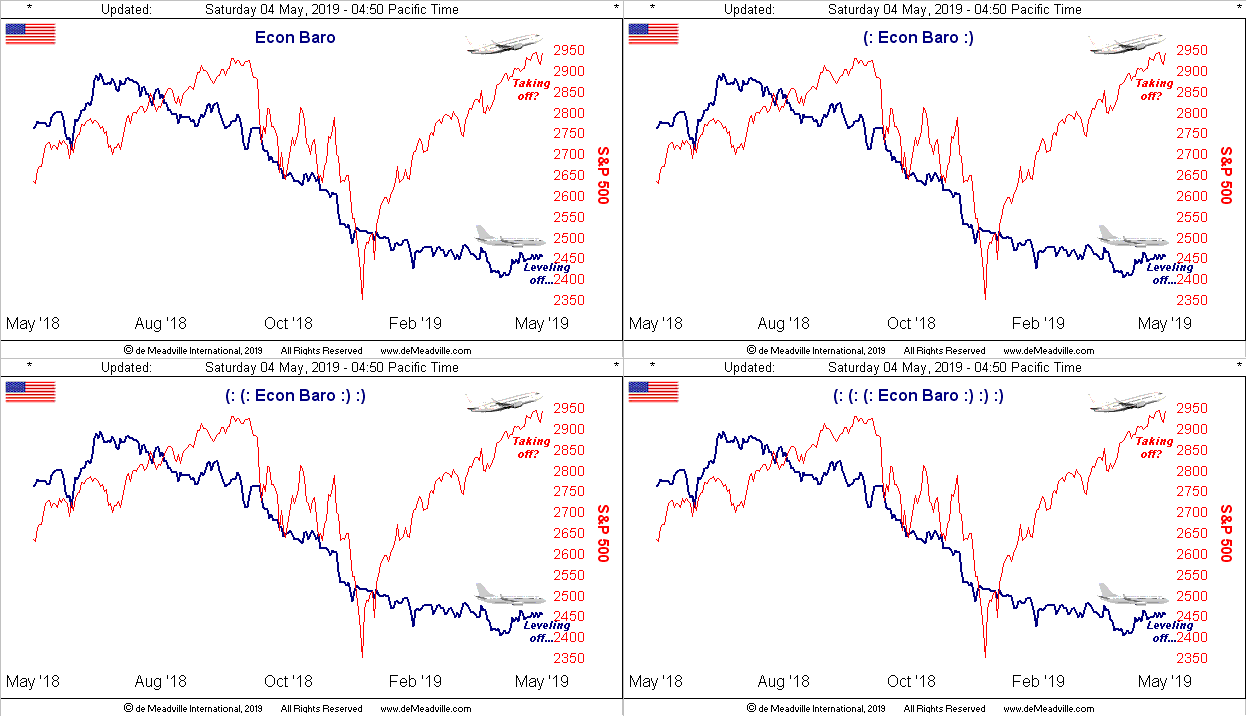
Where we are seeing a difference is finally some leveling off by the Economic Barometer, aided as noted in the prior week by Q1 Gross Domestic Product annualized growth of 3.2% (which we expect to be revised lower given the broader downward tilt of the Baro) and April's firm creation of 263,000 Non-Farm Payrolls, the fourth-best reading in the 24-month Trump-stint, (the monthly average being 194,000). "Things are good", and with the Fed's favoured inflation reading being flat for Core Personal Consumption Expenditures in March, Goldilocks, too, is prancing about at the party. But hidden growth forbearers are there as well: April found notable drops in both the Chicago Purchasing Managers Index and Institute for Supply Management surveys, whilst March Construction Spending fell 0.9%. Here's the whole picture:
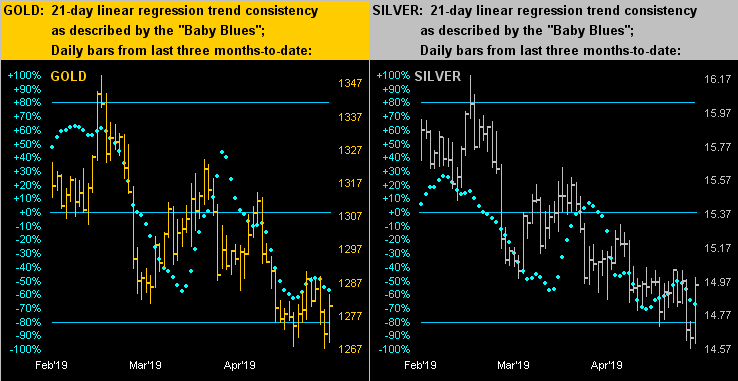
As for near-term trend in the precious metals, a week ago 'twas looking toward becoming our upside friend. The baby blue dots of linear regression trend consistency across the last three months of daily bars for Gold on the left and Silver on the right were turning higher, but this past week they resumed falling. Yet fortunately Friday brought buying force to the fore, especially for Sister Silver: her low-to-high range (14.600 to 14.995, or +0.395 points) was her best intra-day rise since 01 March:
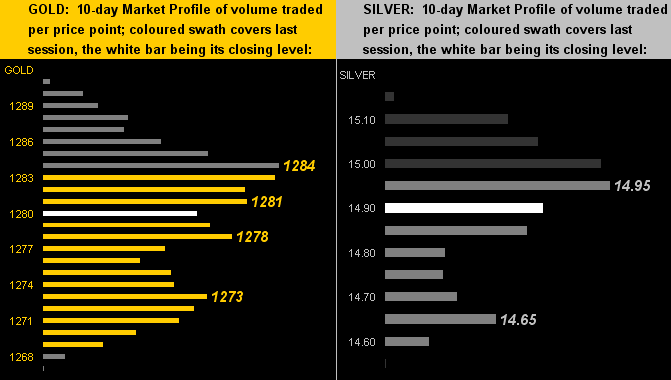
Friday's surge served as well to put prices respectively back up to mid-Profile as we next see for Gold (below left) and Silver (below right) within the past 10-days:
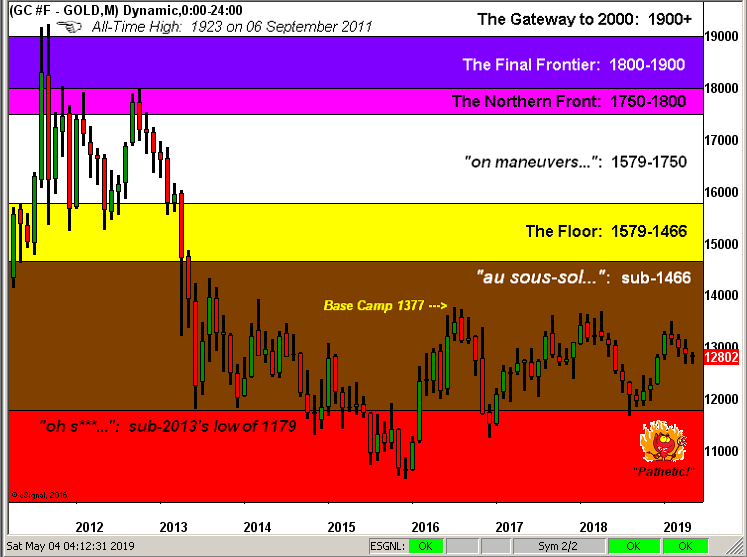
But in the broadest picture for Gold from its All-Time High far too long ago, early May shows price into the fourth month of a stumble, much to the jeering of the zero-I.Q. dude down there:
Next week is back-loaded with inflation data, the PPI due Thursday and the CPI come Friday. Shall it be sufficiently benign to support the President's call for rate hike rescissions? The "estimates" say "no". But as we don't really know, likely best that you load up with Gold!