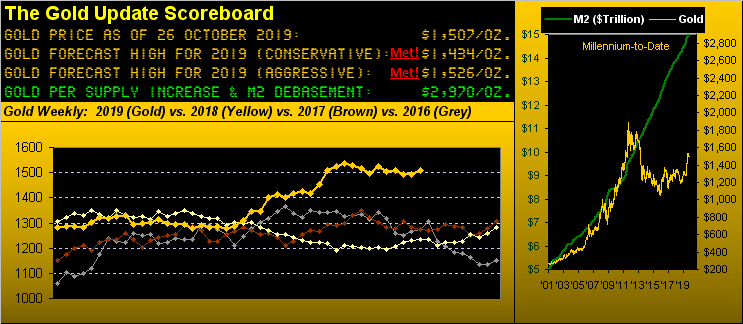
Of the 43 trading weeks thus far in 2019, there've been but 19 (44% of 'em) for which Gold and Silver have both recorded net gains. For the other 24 weeks, Gold and Silver either have both recorded net losses (14 weeks) or have wandered away from one another (10 weeks). And yet both precious metals are sporting solid performances year-to-date with Gold +17.3% and Silver +15.9%. Which means when they both go up, they both go up!
'Course, unless you've been wasting your time getting your FinInfo from FinTV, you already well know Silver's upside performance has terribly lagged that for Gold since their big bottoming back in 2015. And in fact, we can go back even farther than that: the last trading day for the Gold/Silver ratio being spot on its then millennium-to-date average was 08 November 2013, nearly six years ago, the ratio and the average that day both at 60.0x. Ever since then, the ratio has exceeded the average, respectively today being 83.6x versus 64.8x.
So given Gold settling out a meek week Friday with a +0.9% gain to 1507, but Silver settling with a more robust gain of +2.6% at 18.04, were the latter instead trading at that 64.8x millennium-to-date average, price would be 23.26, (i.e. 29% higher than currently 'tis). Just sayin'...
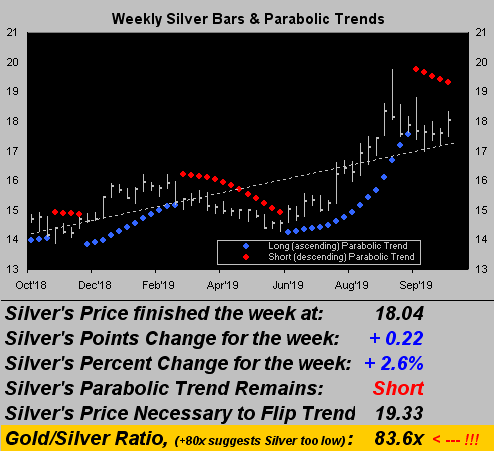
But across the spectrum of the BEGOS Markets (Bond, Euro/Swiss, Gold/Silver/Copper, Oil, S&P 500), save for a super week put in by Oil (+5.2%), Silver was the stellar performer with her +2.6% gain, the balance of the bunch sheepishly shifting one way or the other for little net change, (the S&P teasing but not quite reaching its all-time high). 'Twas Sister Silver's sixth best week of the year, her out-performance thus deserving this look at her weekly bars and parabolic trends from one year ago-to-date. Like Gold, Silver is sporting the descending red dots of parabolic Short trend, but her rightmost upside price coil appears more springy...
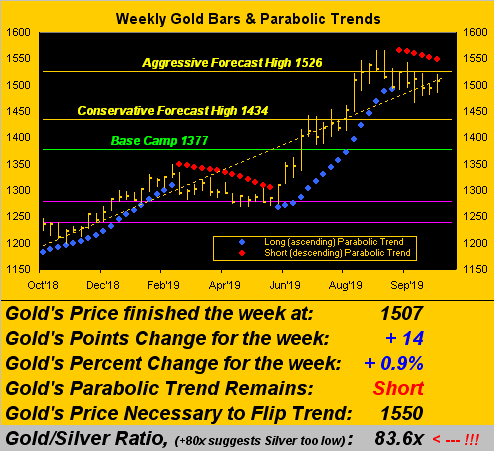
...than does that for Gold as we look below at its weekly bars. Still, the technical good news for Gold is that its present parabolic Short trend remains shallow at best, the 1454-1434 support area not even having been put to the test. But price coiling or otherwise, Silver wins the week's Springy Award whilst Gold appears comparatively bored; (unless of course you've an equity holding such as Agnico Eagle Mines (AEM), the Q3 earnings per share for which bettered themselves from 1¢ a year ago to 37¢ this time 'round, the stock in turn posting a net gain for the week of +8.5% ... not boring):
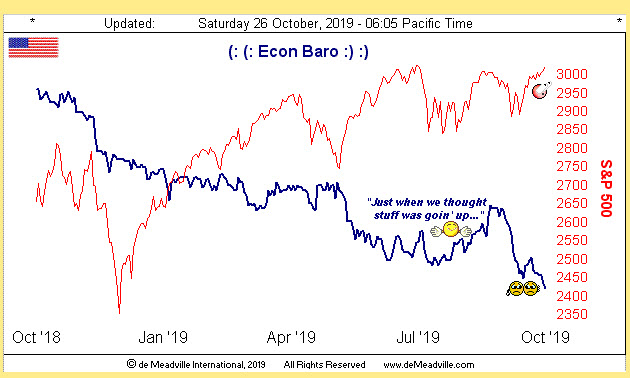
But boring deeper down is our Economic Barometer, its negative track in turn being precious metals-supportive as is the baked-in-the-cake policy decision come Wednesday (30 October) by the Federal Open Market Committee to reduce their Bank's Funds Rate into a target range of 1.50%-to-1.75%, such area to be aided by the Fed's renewed Treasury Bills buying binge, which does "not represent a change in the stance of monetary policy." Ok, good. Not good: September's slippage in Home Sales, both New and Existing, as well as the negative turn for Durable Orders. At least as noted, the S&P 500 is on the threshold of a record high, ("live" price/earnings ratio 35.5x and yield 1.998%). Here's the Baro:
Now earlier we mentioned the BEGOS Markets: let's next go 'round the horn with them. In each component's panel we've the daily bars from one month ago-to-date along with the baby blue dots which denote the day-to-day consistency of the linear regression trend, itself being the diagonal grey line. And unless you're Mr. Bond, life is pretty good, albeit the EuroCurrencies have begun to somewhat throw in the towel. Again note Silver, its rightmost bar (Friday) clearly the star performer, even in giving back half the day's gains:
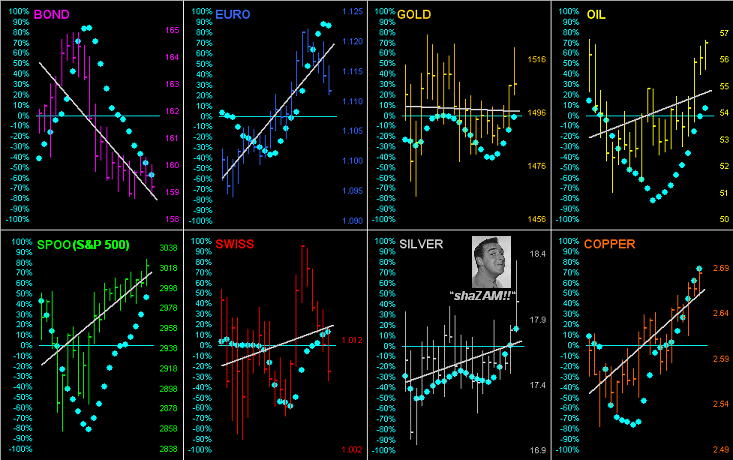
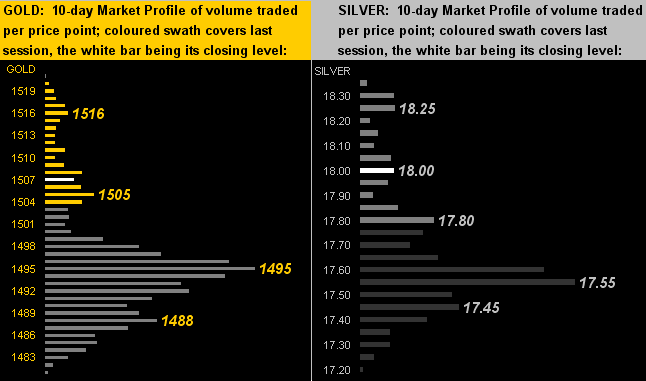
As for the 10-day Market Profiles, both Gold (below left) and Silver (below right) expanded their ranges to the upside, notably in the past week's last two days. From Thursday's respective lows through Friday's highs, Gold rose $31/oz. (+2.0%) ... and Silver 90¢/oz. (+4.9%). "shaZAM!!" indeed:
Now let's peek at next week: the amount of data crossing the transom is massive, (so much so that perhaps the S&P shall simply finish "unch" ... it does happen). That noted, 19 metrics hit the Econ Baro including October's payrolls creation; 155 of the S&P 500 constituents report earnings; the FOMC votes as noted for the rate cut; reversions to "standard time" bookmark the week (Europe this Sunday, Stateside next Sunday); and in the midst of it comes all the scariest Halloween on record: Brexit! Or not? Trick? Or treat? Hardly does any of it look neat.
We close with these two observations:
1) "Tesla (NASDAQ:TSLA) wows with quarterly net profit" reads the excitable headline. But from our perspective here in San Francisco, (or what's left of it), what's so "wow" about it? Today we've no middle class. Either one lives in the streets, else lives in elegance. Those who are street-bound have no car. The balance so do, indeed dominated a decade ago by Priora all over town: they were all you saw. But 'round town today, the Prius is très passé, as essentially every car creeping along our standstill freeways and potholed streets is now a Tesla. Thus any reported "wow" per this vantage point rather would be of a quarterly net loss. "Got coal?"
2) We're quite confident that there was no way you astute market followers missed the launching this past week of S&P Dow Jones (take a breath) Goldman Sachs Commodity Index Skim Milk Powder, (symbol SPGSSP). But just in case you're wondering, we're not envisioning the powdery product becoming a correlative component of the BEGOS Markets ... but when it comes to health, "Got milk?"
'Course when it comes wealth, (and you knew this was coming), "Got Gold?" Perhaps there is some correlation afterall...
Oh now yer mooin'...