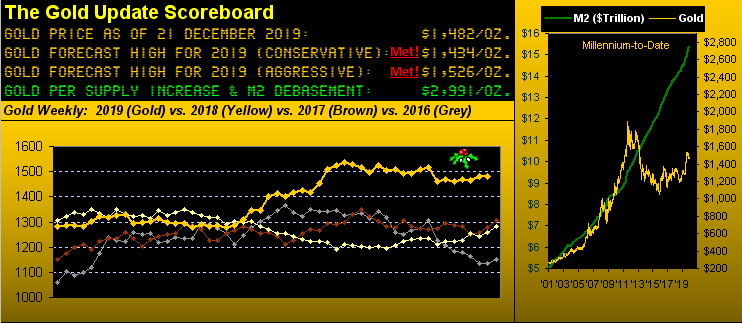
Our five most recent missives have been championing Gold to:
1) not only stay buoyed by the 1454-1434 "support shelf" as we've seen, but moreover
2) rise into year-end, typically as it has done in the prior three per the above Scoreboard.
And yet the upward glide has at best been tepid, price five weeks ago having settled at 1469 (on 15 November) and then Friday at 1482.
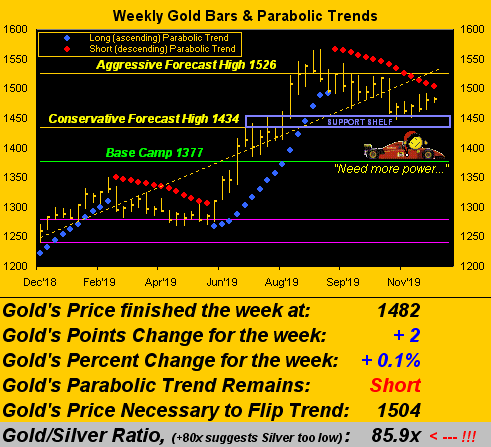
With but two trading days left until Santa's great ride, and just six trading days on the table to conclude 2019's glide, for Gold to close it out above 1500 means going into Formula One mode, a call from the driver to the race engineer going something like this:
Gold: "How much gap do I have?"
Engineer: "The gap is 18, mate, your last lap at 82"
Gold: "Tyres feel good but I need more power"
Engineer: "Go to setting yellow G3, mate, setting yellow G3"
Gold: "Copper almost hit me at the chicane, what the [radio breakup] is he doing?"
Engineer: "We've notified the stewards, mate. Pace is good, mate, keep going"
It goes without saying to always keep your driver in a positive mindframe. But as for added power, indeed such dial on Gold's steering wheel need be turned up a notch as trading ranges are narrowing across the entire spectrum of the BEGOS Markets (Bond, Euro/Swiss, Gold/Silver/Copper, Oil, S&P 500). To wit, here are our year-over-year tracks of "expected daily trading range" for Gold (below left) and Oil (below right), our choosing to also display the latter given its getting so much press of late and yet price itself barely budging:
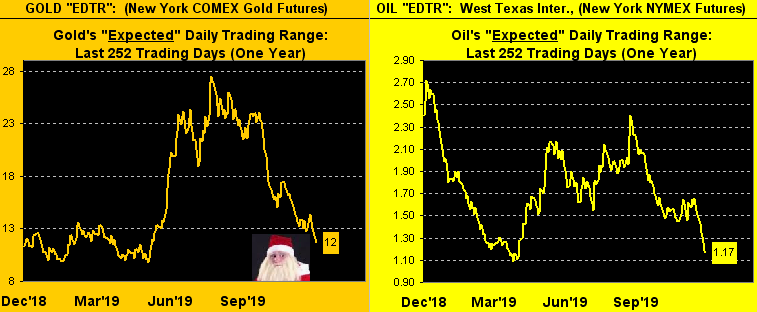
Gold's "EDTR" of just 12 points advocates price needing two firm up days for Santa to gift 1500 Gold; regaining that level by year-end allows for more leeway as the "expected weekly trading range" at present is 35 points. But even by its most recent week -- the range having been just 12 points from low-to-high and moreover the narrowest trading week since that ending 25 November 2005 -- in turning to Gold's weekly bars, the rightmost one is barely a nub. "Go to setting yellow G3, mate." There's a thought:
Meanwhile, powering up albeit fraught with fits, is the balance of incoming economic metrics. December's National Association of Home Builders Index reached an all-time high of 76.0. November's Housing Starts and Building Permits raced higher as did both Personal Income and Personal Spending. "We're in the money, we're in the money..."--(The Gold Diggers' Song, Dubin/Warren, '33). 'Course, it might be wise to go digging for some Gold as December's Philly Fed Index fully flopped to 0.3 from 10.4 and November's Leading Indicators languished unchanged. Here's the Econ Baro and the S&P 500 (red line) in its own Formula One power mode as it races up and away from the pack:
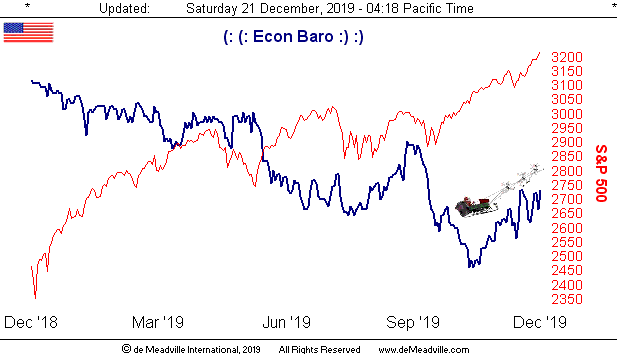
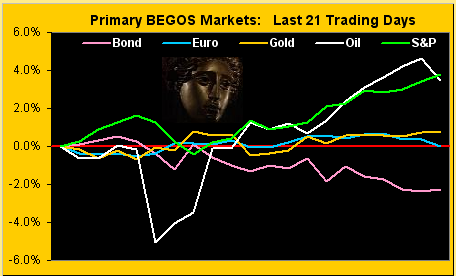
To look at the upward drives in the above Baro graphic, one ought think that Gold is, as they say, "taking it in the shorts", or more suitably stated, "taking in the Shorts". But said Shorts certainly would be suffering despite their arguing that yields, the StateSide economy and the S&P are all rising. Clearly Gold must be falling, right? "Yup!" But is it? "Nope!" Here are the percentage tracks from one month ago-to-date for the Bond (falling price = rising yield), Euro (flat), Gold (higher), Oil (higher) and the S&P (higher). Swimming against the tide and winning is Gold. "Why?" When something is offered at half its fundamental value, it shall be bought, (i.e. Gold as foretold). 'Course, when something is bid at double its fundamental value, it shall be sold, (i.e. the S&P eventually):
"That's The Sibyl, mmb..."
Indeed a re-appearing there, Squire. By the way, where've you been?
"Still clearing ski runs in the Dolomites, mmb..."
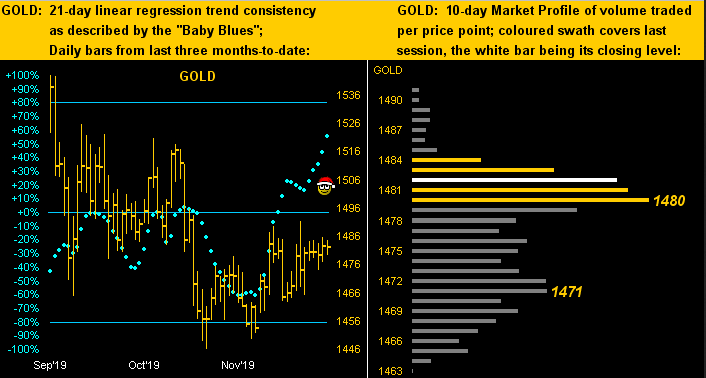
(Sometimes we're sorry we ask). Nonetheless clearing their way higher are Gold's "Baby Blues" as we below see on the left in the three-month panel, indicative of the linear regression uptrend regaining some consistency; and on the right as depicted in Gold's 10-day Market Profile are the trading supporters at 1480 and 1471:
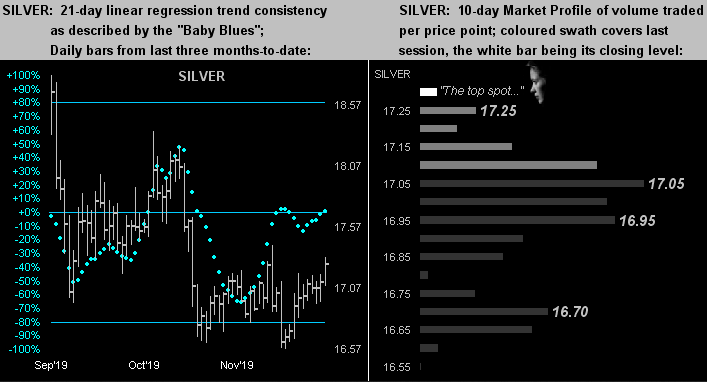
As to the same graphical portrayal for Silver, her blue dots (below left) are only just now crossing above the trend-defining 0% axis. That is, in part, due to a sterling Friday trading session to close out this past week at 17.265, the highest daily settle in some seven weeks, in turn pulling down the Gold/Silver ratio from 87.1x a week ago to now 85.9x. And in justified reward, Silver Silver finds herself at the very top of her Profile (below right):
Thus into Northern Hemisphere Winter we go, Gold itself needing to dial in a little more power to regain 1500 from now into New Year. 'Tis within range as so we've explained. So Season's Greetings to all and may Gold be your call!