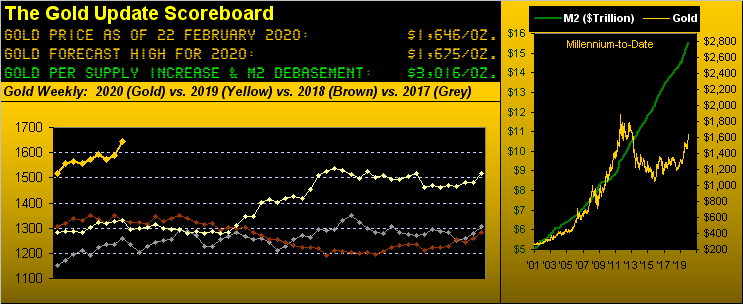
Indeed there 'tis in the Gold Scoreboard: "Gold Forecast High for 2020: 1675". With the actual price having settled out the week on Friday at 1646, the high en route was 1652, just 23 li'l ole points away from 1675. And 'tis only February!
Moreover, from the "Worst to First Dept.", Gold just two weeks ago posted its worst net weekly loss (-1.2%) in three months; then this past week, Gold garnered its best weekly gain (+3.7%) in six months. So once again we beg the question: "Is this IT?" Here are the weekly bars from a year ago-to-date:
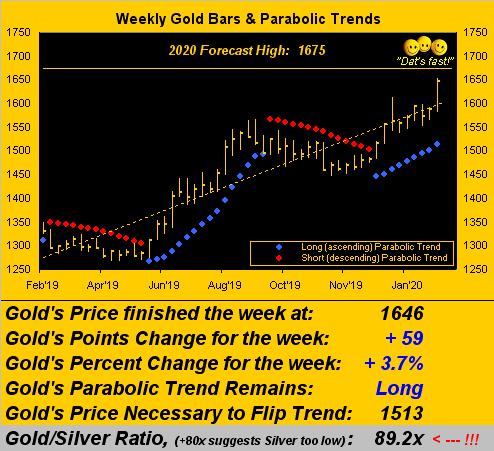
Regardless of how one defines "IT", we can justify at least four of 'em that are inevitably out there:
■ "IT" (part un) is the forecast 1675 high during this year; given Gold's "expected daily trading range" is at present 18 points, with price now at 1646, it can be there by Tuesday;
■ "IT" (part deux) is the milestone 2000, our personal goal toward maintaining these weekly missives;
■ "IT" (part trois) is the supply-adjusted dollar debasement value 3016, per the Scoreboard;
■ "IT" (part quatre) is the "overshoot" of the foregoing upon the 3Ds (Debasement, Debt & Derivatives) all coming due without the dough to come through; "Have a nice a day."
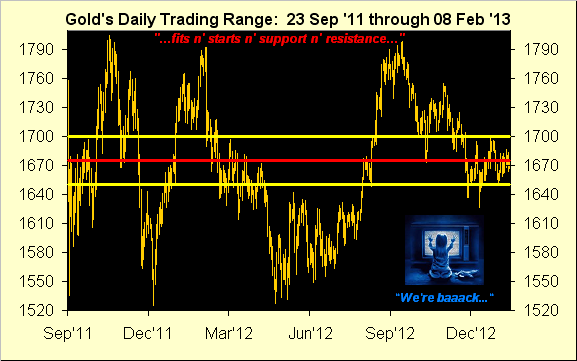
For the present, let's focus on the forecast 1675. Do you recall why we selected it for this year's high? Here's your refresher from 2020's opening Gold Update: "...our call for 1675 ... may seem conservative to some ... but when markets return to levels of the past, pricing structure comes into play, that very 1650-1700 zone again being rife with fits n' starts n' support n' resistance. Yes, we expect Gold to get there, but 'tis the what then happens from there that counts, luv..."
And indeed, luv, we're already just about there. Here's a graphic reminder of Gold's pricing from 23 September 2011 through 08 February 2013 -- a bona fide year and a half -- through which Gold chopped 'round the red-line centerpiece of 1675 as shown within the yellow-bounded 1650-1700 zone:
Query: Were the coronavirus epidemic not evolving "as reported", would Gold even be in the 1600s Saturday? To be sure, its spreading is scary (fear driving up the price of Gold), and its economic slowdown effects opening the coffers for easy money (the expanding 3Ds certainly driving up the price of Gold). 1675 justified; say no more.
BUT: absent the coronavirus (and notwithstanding the foregoing "ITs"), consider this from Friday's Prescient Commentary: "...we're mindful that the dollar is putting in a relatively strong performance this year such that as coronavirus issues fade, Gold is subject to correcting significantly..." Further, in the near-term offing, 'twill be the collision of the human herd racing into Gold versus the trading algorithms well wary of the above-charted fits n' starts n' support n' resistance within the 1650-1700 zone. Cinématically we've: "'The Herd vs. Algore', starring Goldzilla. Man or machine? Someone's got to lose... (In theatres next week)".
"Quel drame, mmb."
Your waxing eloquent in French, Squire, is yet another testament of your cultural expansion. But indeed, this is one of those dramatic Gold pricing areas up through which to drill, or from which to spill. Riveting stuff!
Either way, we're merely pointing out that both Gold and the Dollar Index are up year-to-date by +8.3% and +3.2% respectively, (Gold thus playing no currency favourites), the rationale ranging from safe haven veins to StateSide economic gains. In fact, the latter are appearing sufficiently substantive that ("Don't say it!") might the Federal Open Market Committee whisper of interest rate hikes at their 17-18 March meeting? A contained coronavirus, Dollar strength and rising rates would not bode well for Gold. Here's the Economic Barometer:
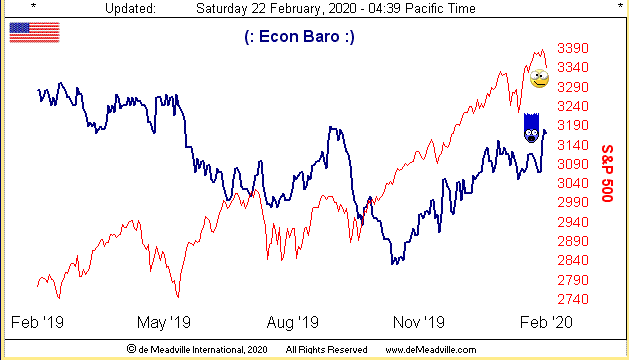
And a hair-raising week 'twas for the Baro: February's New York State Empire Index nearly tripled the prior month's reading, whilst that for the Philadelphia Fed Index doubled. January's Housing Sales softened, however Building Permits increased nearly 10%; the Conference Board's Baro-lagging indicator of Leading Indicators rose by the most in two years; and the month's wholesale inflation ran at an annualized pace of +6%, (triple what has been typical). How's that FedFunds rate hike gonna work out fer ya, eh? Just sayin'...
And yet through it all, weakness (certainly coronavirus-influenced) is perceived, the StateSide 30-year Treasury Bond yielding below 2%. Europe's normally-leading thoroughbred -- Germany -- can't get out of the starting gate such that EuroZone finance ministers are actually discussing growth-friendly fiscal policy (the next step when monetary rates already are down to 0%); the British Bank with the Asian name (HSBC) looks to reduce its workforce by 15% in nixing 35,000 jobs. And Japan's economy is contracting the most it has in six years. As for Q4 Earnings Season, with some 80% of the S&P 500 constituents having reported, 66% of them improved their year-over-year bottom lines ... which means one-third didn't ... just in case you're scoring at home even as our live price/earnings ratio dips below 40x to 39.9x.
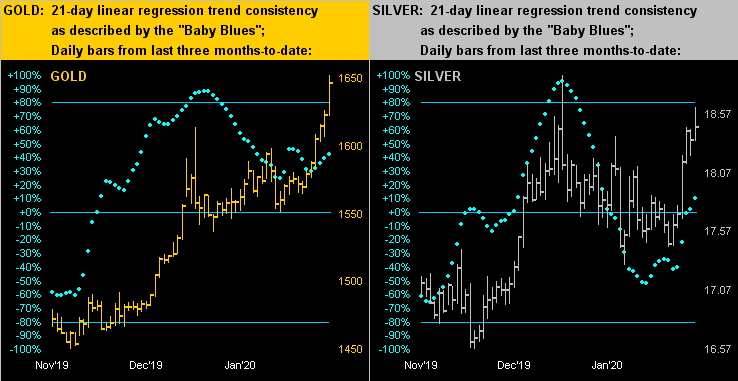
Speaking of ratios, that for Gold/Silver basically refuses to budge from historically high levels: 'tis at this writing 89.2x; the millennium-to-date average is 62.9x, which at Gold's present price of 1646 "ought have" Silver Saturday at 26.17 (some +42% above her current 18.46 level); hang in there, Sister! And as we turn to both metals' respective panels of their daily bars for the past three months-to-date, clearly the yellow metal's overall uptrend on the left shows more forthright that does that for the white metal on the right. Of concern however for both cases is the lack of consistency borne by the baby blue dots: messy "Baby Blues" oft lead to traders' turning tail:
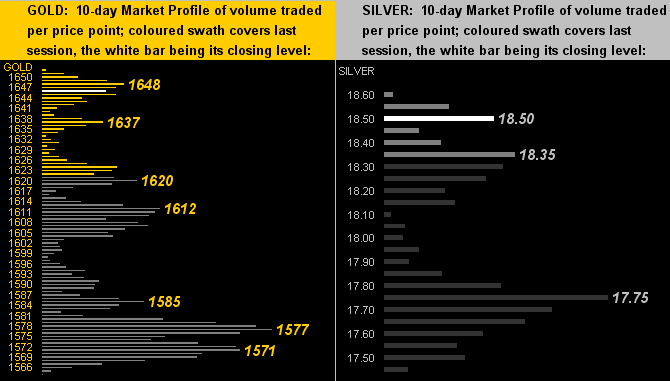
As for "The Now", the safe haven rush has expanded the 10-day Market Profiles for both Gold (below left) and Silver (below right), their dominate volume-traded prices as denoted:
To close: if, as some assert, we lose Earth in ten years, having Gold shan't do us much good. Fortunately, there's hope. As noted a week ago, Delta Airlines (NYSE:DAL) -- toward mitigating global air travel's climate impact -- is committing $1 billion to the cause. Then this past week, Jeffrey P. Bezos has come in tenfold at $10 billion. Do we thus hear $100 billion for the ensuing week? Mayor Mikey estimates his worthiness at $119 billion... but were he to come through with $100 billion, 'twould only leave him with $19 billion. A tight residual perhaps on which to then live, but surely he'd gain the Presidency per promising to save The Planet. Otherwise without it, 'twouldn't be worthwhile, what? But at the end of the day, let alone ten years, with 1675 as the first "IT" in the balance, we see Gold as the best stance!