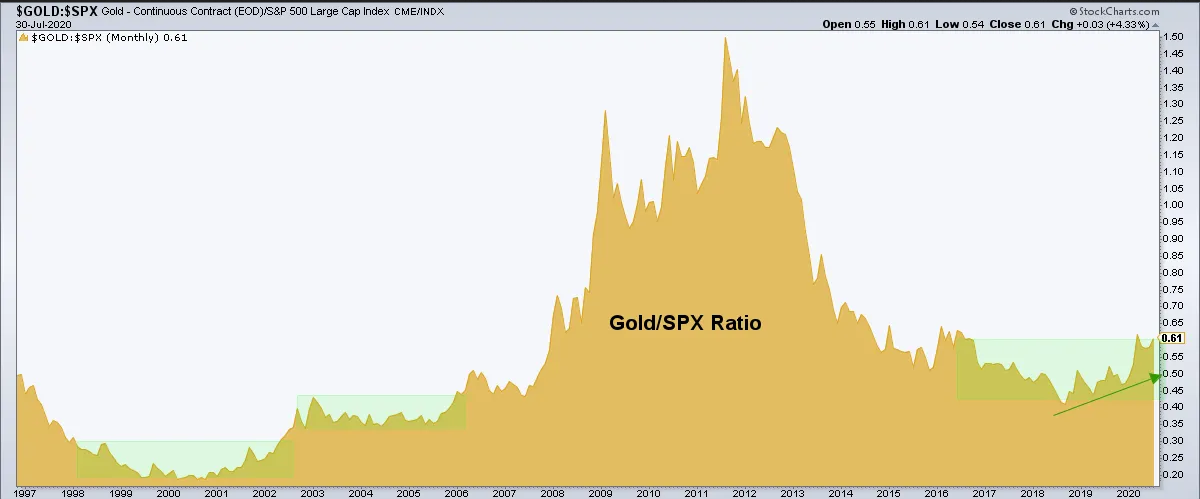
As tracked in NFTRH, in 2019 the macro backdrop became positive for the gold stock sector as gold entered a bull market by taking out the 1378 level and its ratios to stock markets began to rise. Gold/SPX is among the most important macro indicators to a bullish gold mining case as a gold price rising in terms of stocks is the key factor in drawing larger investment (e.g. institutions) to the sector.

That is of course only one of the positive macro developments for the sector. The Macrocosm shows Gold vs. Stocks and the other considerations (the larger the planet, the higher the priority for a bullish view).

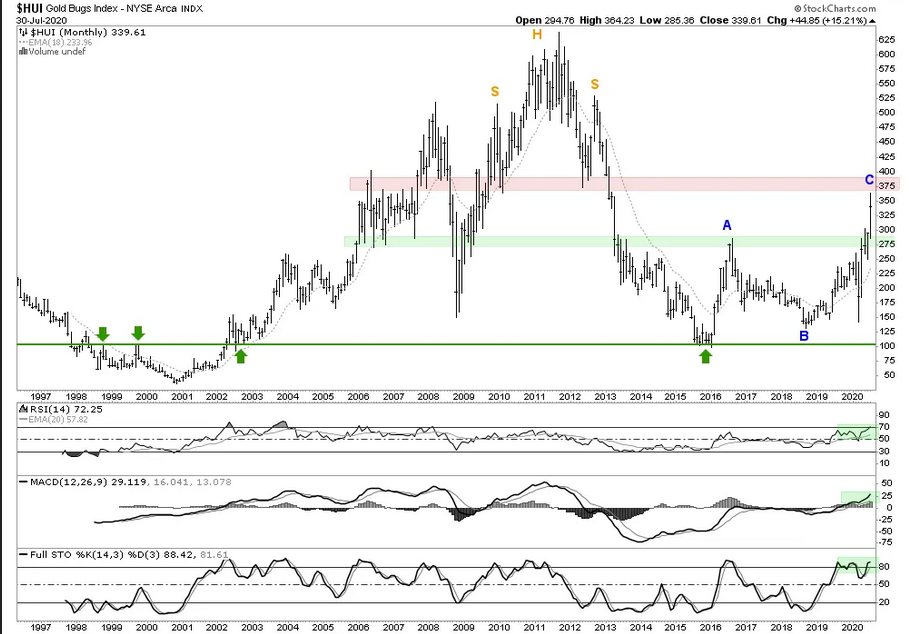
That is a short history of the current bull market. This monthly chart and others like it were originally used in NFTRH to plot the prospect of an intense A-B-C bear market rally. In 2018 when HUI made a higher low to the 2016 low (itself the downside objective of the old H&S) we speculated that it was a ‘B’ down with a ‘C’ up still to come.
Conservatively managing this situation (because there was no reason not to be conservative since our target was over 100% higher, regardless) as an A-B-C bear market recovery, we’ve had the objective (375) loaded for over a year, regardless of whether it is a bull or a bear. The view has only improved since then, but resistance is resistance, and this resistance is stern.

This phase of the gold stock rally is not indicated to be over, but it is getting long in the tooth. The daily charts, macro indicators and seasonal averages we manage in weekend reports and in updates have been guiding us every step of the way as to what is a real correction and what is merely a shakeout pullback. Here is a public post that correctly anticipated the end of the last routine correction.
Here is a brief subscriber update from June (now public) that shows brief in-day management of VanEck Vectors Gold Miners ETF (NYSE:GDX) and VanEck Vectors Junior Gold Miners ETF (NYSE:GDXJ). We use these updates during the week to be sure we are properly in line with the shorter-term technicals. In other words, trends and support are what they are until/unless violated.
And we have been on the case with silver since the March crash that our reports and updates speculated was the beginning of a bull market, a classic and terrifying crash, shakeout and reversal that the precious metals in general and silver in particular tend to put on once in a while.
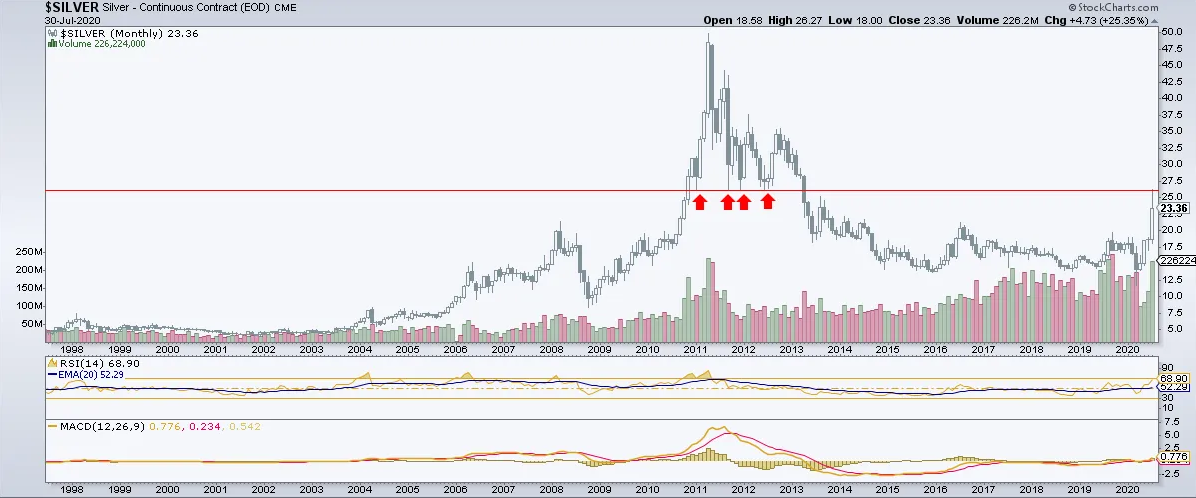
We managed silver’s rise from the March disaster, targeted its bull market gateway (2016 high at 21.23) and measured an ultimate cyclical bull market objective 24-26 that surprised me with the speed with which it was put in the books.
That is good and bad news. The good news is that the rapid rise to 24-26 has made silver a candidate to break through to a longer bull market than the short cyclical one originally envisioned. The bad news, short-term at least, is that resistance is resistance until exceeded.

Our management to this point has not just been nominal technical work. It has included macro fundamentals as shown above and it has included indicators like the Silver/Gold ratio. My main interest is the gold sector. But when silver gets on its horse things can get interesting (and driven to extremes).
So it is time to watch silver vs. gold, mining macro and sector fundamentals and of course shorter-term technicals to manage what I believe could be an extended bull market, but which is approaching a key resistance area at this time. Meanwhile, Huey keeps pushing that cart of rocks.
