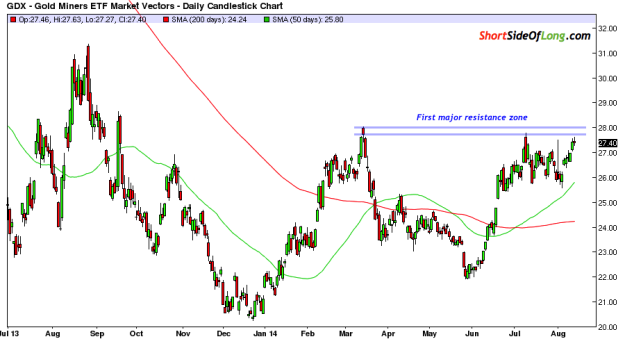
Chart 1: Gold Miners have performed quite well since late May bottom
Yesterday I had quite a few conversations with various newsletter writers and traders about the same topic: Gold Miners. It seems that a lot of market participants are paying attention to this asset right now, so I thought I would write a very quick update on the topic as well.
As we can clearly see in Chart 1, Gold Miners have performed quite well since the late May bottom. The initial rally in June has been consolidating in the month of July and August, as Gold Miners now find themselves at a first major resistance zone. Silver miners have also been doing just as well.
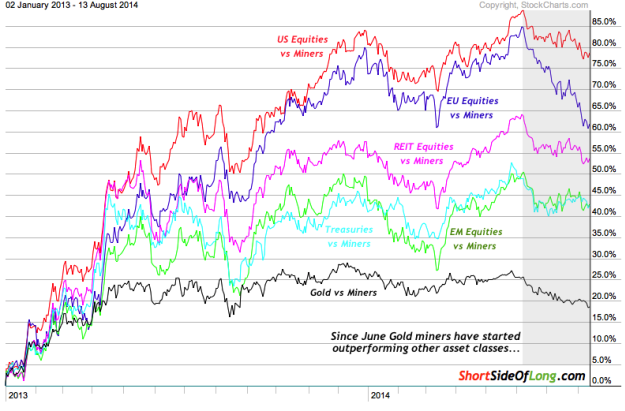
Chart 2: Gold Miners have been outperforming Global Macro assets!
Source: Stock Charts (edited by Short Side of Long)
Gold Miners have started to show improving relative strength against major global macro asset classes (please refer to Chart 2). What does that mean? Well in plain English, Gold Miners are holding their own while the rest of the assets from global equities to junk bonds and from REITs to agricultural commodities have been experiencing corrections.
From the price perspective, S&P 500 is currently testing its support trend line; while HUI Gold Miners Index is testing is resistance trend line. Gold bulls claim that a potential reversal in this trade is about to occur, where US equities enter a bear market while Gold Miners enter a bull market.
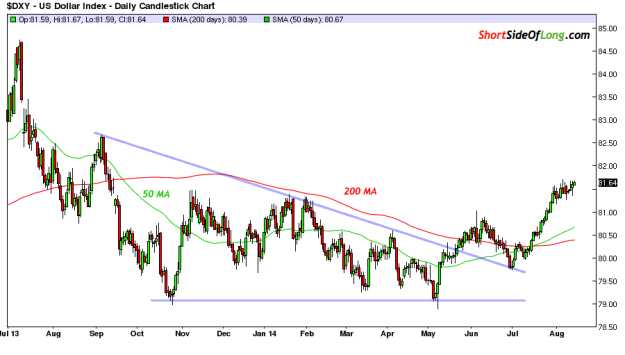
Furthermore, it needs to be stated the outperformance of Gold Mining shares is actually occurring during a strong US Dollar rally, which usually tends to be a headwind for the overall precious metals sector (refer to Chart 3). So far the rise in the Dollar can mainly be attributed to a weak Euro and has not impacted the Gold mining sector (yet).
Chart 3: US Dollar rally has not put any major pressure on miners (yet)
Source: Bar Chart (edited by Short Side of Long)
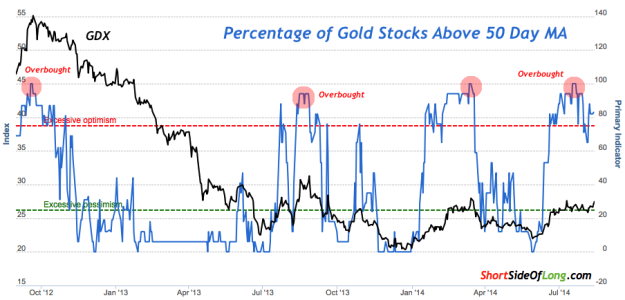
Finally, when we look at breadth reading in Chart 4, we could conclude that Gold Miners are showing very strong market participation. Now, I understand that precious metal bears will conclude that previous high breadth readings have led to sell offs. So why would it be an different this time around?
However, historical observation of this indicator shows that overbought readings very common during bull markets, where it is healthy for as many stocks as possible to be participating in the uptrend. If Gold Miners and the rest of the sector decide to break out on the upside into a new uptrend, high breadth readings should be considered a positive and not a negative.
Chart 4: Overbought breadth or a signal of strong sector participation?
Source: SentimenTrader (edited by Short Side of Long)


