VanEck Vectors Gold Miners (NYSE:GDX)
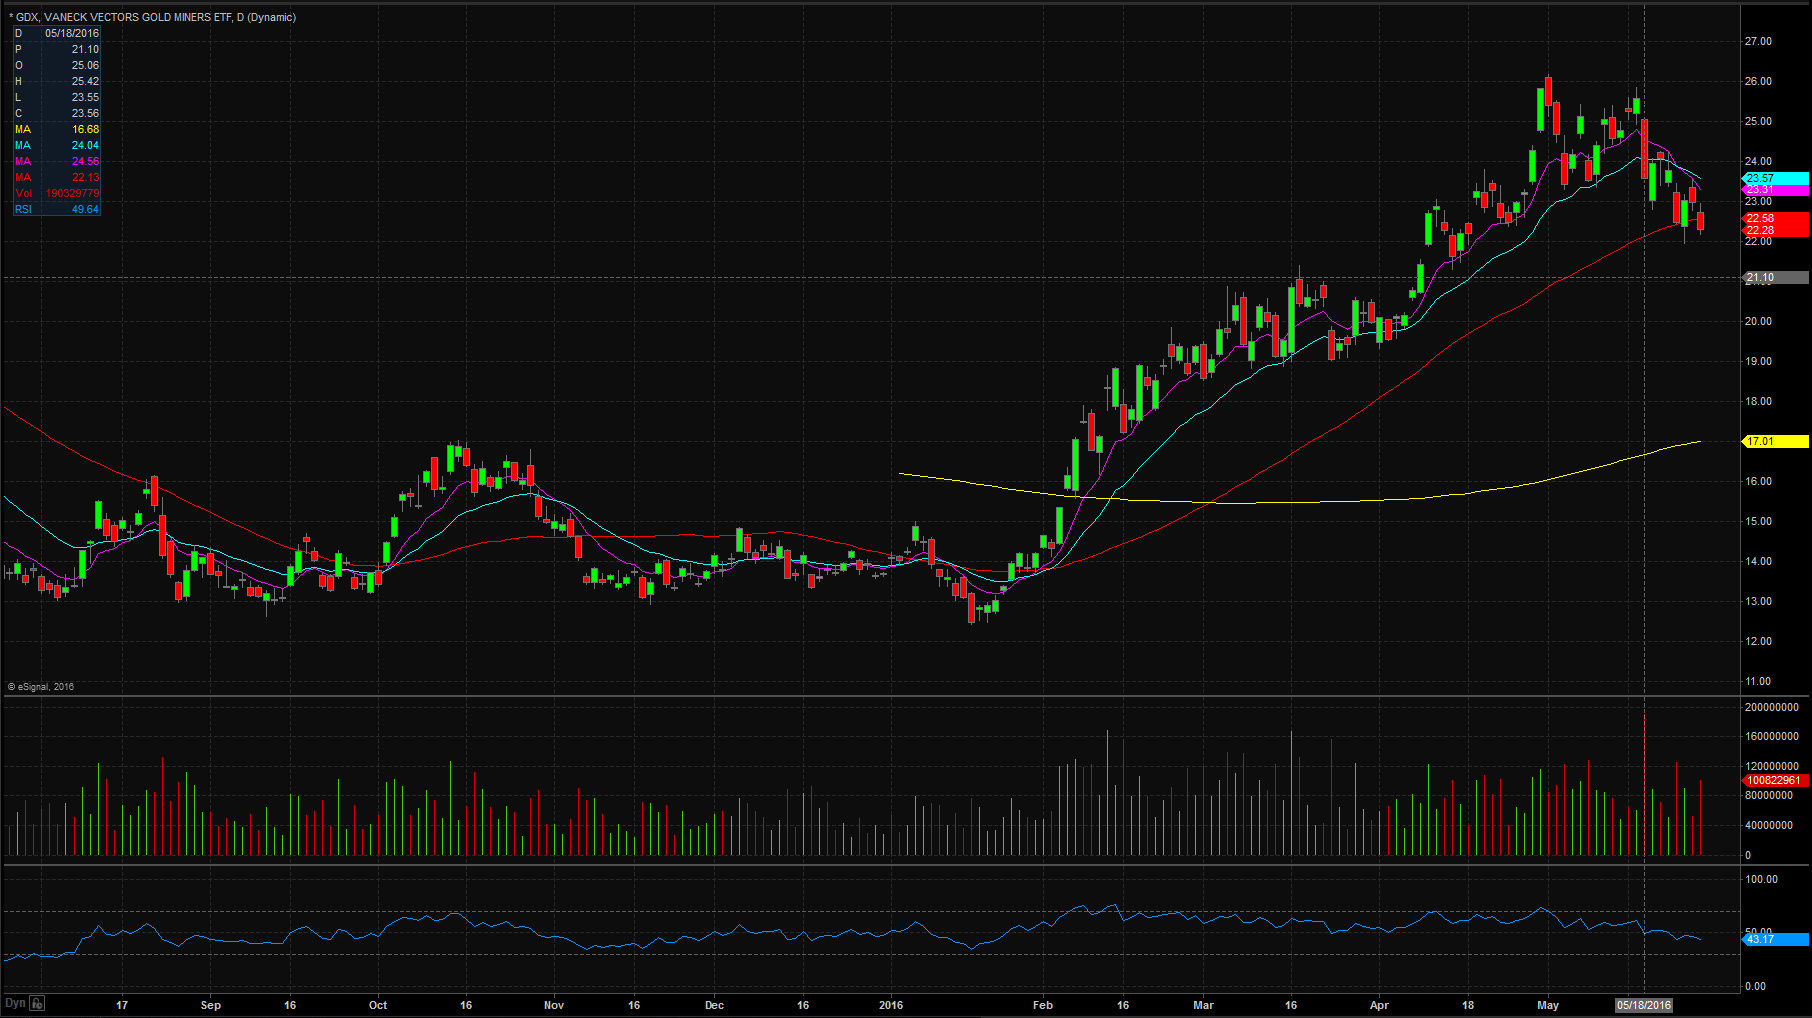
After nearly a 100% run since its January 2016 lows, the Gold Miners ETF (NYSE:GDX) has found some resistance in the mid-20s. Although the ETF has appeared to find a floor in late 2015–trading range bound 12-17 from August 2015 to January 2016, and then breaking out to the upside on high volume in February– it may be in choppy waters for some time before the long term uptrend continues. For those long GDX, currently at 22.45, now may be time to consider taking profits.
Technical Analysis

GDX is up 63% year to date and currently trading right at its 50 day simple moving average (SMA), below is 20 day SMA, and below it 8 day exponential moving average (EMA). Given that the ETF has breached its near term support in 23.29, it will be critical to see if the 50 SMA acts as support.
In Tuesday’s trading, the ETF fell 1.31 or 5.51% to 22.47 and for the first time since April 27 closed below its near term support of 23.29. Since the beginning of May the ETF has bounced off these levels and traded upward as seen on May 4th, May 10th, and May 23rd. Now it has broken through this support level and currently sitting at the 50 day simple moving average (SMA) and could be positioned to continue to decline further. The first likely downward target would be 21.40 which is a 4.8% decline from where the ETF currently stands. The 21.40 area is relevant given it has acted as support on April 14 and resistance on March 17. Technical analysis indicates previous support will become resistance and previous resistance will become support.
Negative Chatter on The Street
In an article published on TheStreet.com, Bob Byrne says that Gold “wants to roll over in the near term”, specifically referring to the Gold Miners ETF (GDX). His key support level is 23.35 and since on Tuesday the ETF has failed to close above it, Bob now has a target at the year to date volume weighted average price (VWAP) and 100 day simple moving average (SMA) which is below 20. A fall below 20 would represent an 11% drop from where it is now.
Bearish Option Activity
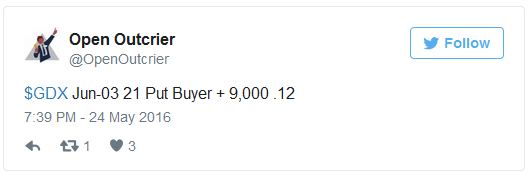
Early in Tuesday’s trading session there was a block of 9000 June 3rd GDX $21 put options traded for 12 cents. This equates to a trader that laid out $108,000 in premium which can be viewed as a bearish bet that GDX will be at or below 20.88 by June 3rd expiration, which is 7.1% lower than its current price. In total there were over 10,000 June 3rd $21 puts traded Tuesday versus Open Interest (OI) at only 452.

Company profile
The investment seeks to replicate as closely as possible, before fees and expenses, the price and yield performance of the ARCA Gold Miners Index. The fund normally invests at least 80% of its total assets in common stocks and depositary receipts of companies involved in the gold mining industry. The index is a modified market-capitalization weighted index primarily comprised of publicly traded companies involved in the mining for gold and silver. The fund is non-diversified.
