Intermarket analysis is a rather new field in technical analysis but one of my favorites because it is critical in understanding Gold. Asset classes such as stocks and bonds are enormous and aren’t as influenced by as many factors as Gold. Trends in stocks, interest rates, commodities and currencies impact Gold in one way or another. We have written many articles over the years analyzing Gold with respect to its outlook and standing in real terms. Gold, when in a true bull market, outperforms against all currencies and the global equity market. Unfortunately that is not the case at present. In real terms, Gold is weak, getting weaker and it could be a reflection of the metal’s worsening fundamentals.
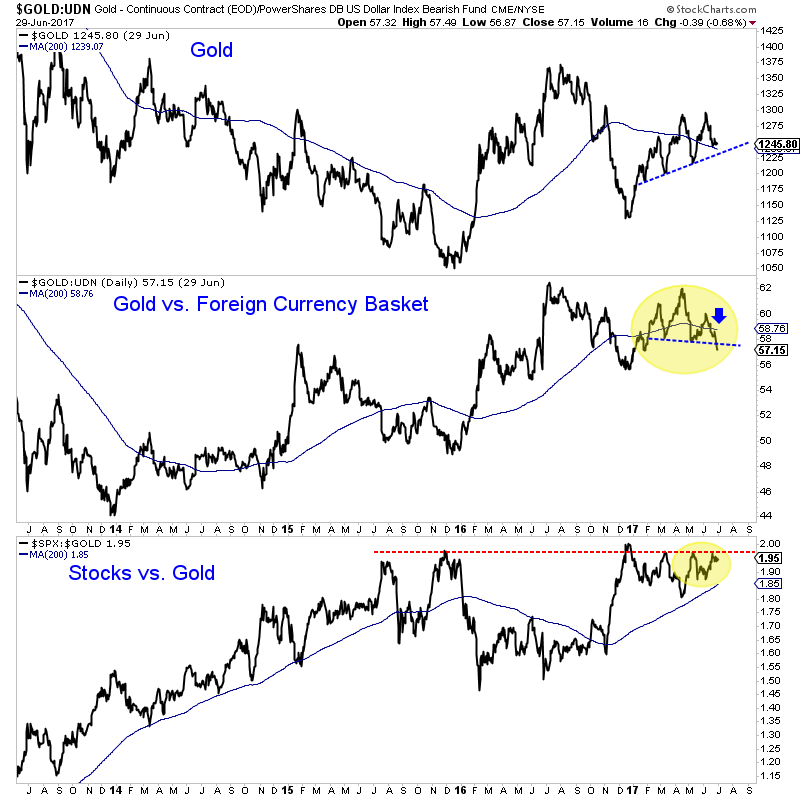
In the first chart we plot Gold along with Gold against foreign currencies (FC) [via UDN] and Gold against stocks (inverse). While Gold (in nominal terms) has yet to break its 2017 uptrend, Gold/FC has and the Gold/Stocks ratio remains on the cusp of a major breakdown. Gold/FC has broken down from a mini head and shoulders top, lost its 200-day moving average and closed at a 6-month low. Meanwhile, the Stocks/Gold ratio is on the cusp of a breakout to a 2-year high. In short, Gold against both currencies and equities is weak and likely to get weaker.

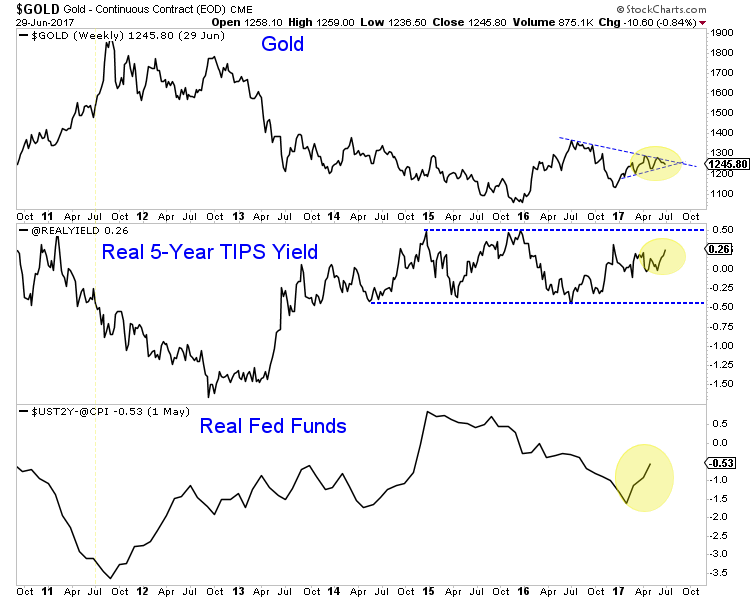
Gold’s weakness in real terms could be a reflection of its worsening fundamentals. As we’ve drilled into the head of readers, Gold is strongly inversely correlated to the trend in real interest rates. Negative and declining real interest rates push Gold higher while Gold struggles amid rising real interest rates.
Below we plot Gold along with the real 5-year yield (calculated from the TIPS market) and the real Fed funds rate (using the 2-year yield as proxy). Inflation, which was rising until recently, is now declining. Interest rates declined since December 2016 but may have put in an important bottom in recent weeks. The result is an increase in real interest rates. Unfortunately, I see a good chance real rates continue to trend higher over the next several months.

Until recently, Gold had been holding up due to a weak US dollar but Gold has become so weak in real terms that even that support is fading. This past week the US Dollar index plunged 1.6% but Gold lost 1.1% and gold stocks (VanEck Vectors Gold Miners (NYSE:GDX)) lost 2.9%. The equity market declined four out of five days but even that failed to help precious metals catch a bid.
As you are probably well aware, the precious metals sector is approaching a breaking point and Gold’s weakness in real terms is another troubling sign. Moreover, Gold’s fundamentals are also warning of a break to the downside. While traders may have an opportunity on the short side, gold bugs and bulls should de-risk portfolios, handle their emotions and wait for the next true low risk buy opportunity.
