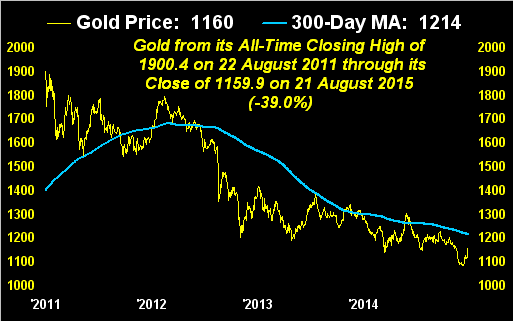
Four years ago last Saturday (22 August 2011) gold settled at its all-time closing high of 1900.4. Today it sits at 1159.9. Happy anniversary? This latest renaissance seems worthy of at least some celebratory mirth.
The 300th Gold Update of a week ago set forth for the cherished metal of many-a-millennium "how we'll know when the bottom is in". That 'twould be marked by gold's price rising "both swiftly and regularly over several days: 70 points here, 30 points there, then a further 50-point flare". And indeed this past week, we actually had up intra-day up moves of 19 points here, 22 points there, then yesterday (Friday) a further 19-point flare. True, the meat may be off a bit from the magnitude sought, but the motion is sufficiently spot on such as to make one sing along with that 1951 hit by The Swallows "It ain't the meat, its the motion that makes your daddy wanna rock." And having risen by as much as 8.9% from the year's low of four weeks ago, gold is beginning to rock whilst the S&P 500 justly gets clocked.
Short of declaring the bottom being in for the yellow metal - as we'd first like to see it return above the 300-day moving average (1214) and then move up on through resistance to settle above 1280 - two great journeys look as being underway for both gold and the S&P toward returning to respective, realistic valuations. And both journeys are long ways through which to war. Yet, let's bring a few facts to the fore:
At the top of this missive, the gold scoreboard values gold right now at 2536 simply as a mitigant to the stateside money supply's (M2) foundationless 35-year seven-fold growth. "Fact!"
The week's fallout in the S&P notwithstanding, now at 1971 'tis down but a wee 7.5% from its all-time closing high of 2131 (21 May). To span a 10% correction on a closing basis - a phenomenon many younger money managers have never experienced - a settle of 1918 need print. "Fact!"
Contrary to current analysis, the "E" in the room is not the Elephant of the Federal Reserve Bank: it shan't risk a rate hike in the face of market turmoil and declining economic indicators. Rather, the "E" missing from the room is Earnings: our price/earnings ratio for the S&P dropped only modestly this past week from 35.0x to 32.8x, meaning the index's 5.8% five-day "plunge" is peanuts and thus the market by "B-school standards" still remains doubly as high as it ought be. "Fact!"
FedSpeak from various Federal Open Market Committee folk in citing a growing economy, further aided and abetted with the FinMedia buzzword of "lift off", sounds blatantly as that of political posturing rather than respect due the economic facts. "Fact!"
In fact, with New York's Empire Index swinging from a 3.9 gain to a -14.9 loss and the lagging report of Leading Economic Indicators going backward from +0.6% to -0.2% - such negativity already having been portended by the Economic Barometer - here is its rather lurid state-to-date:
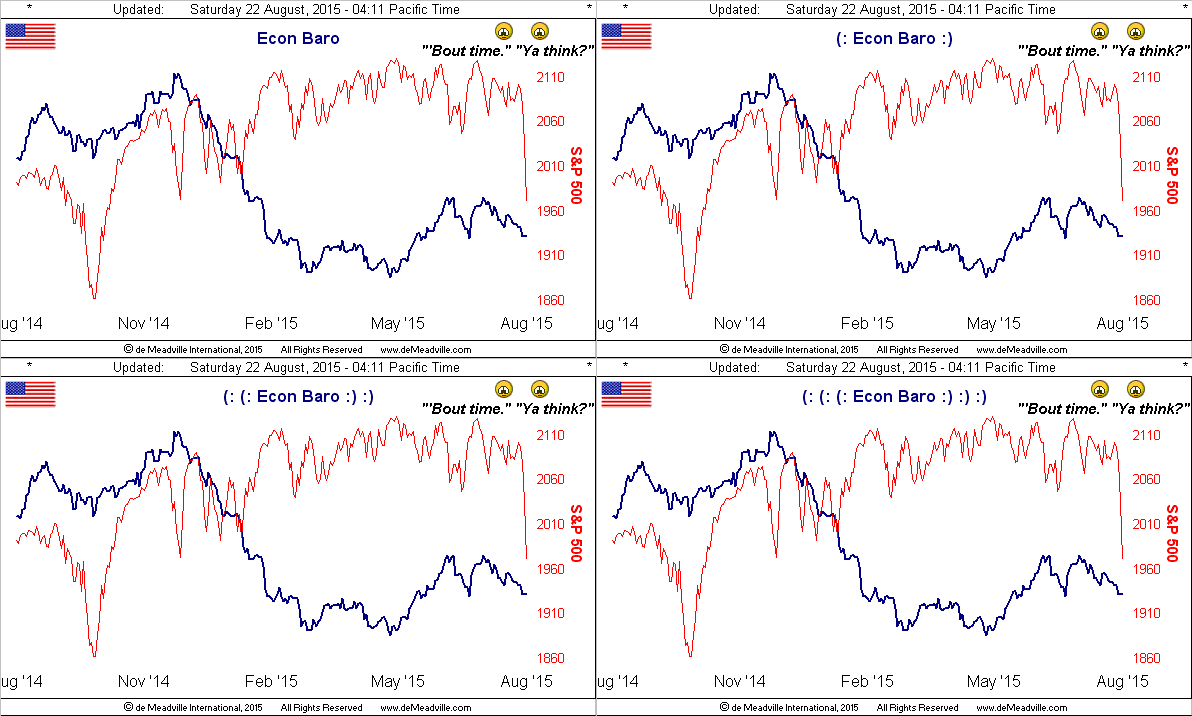
"But mmb, why are you calling this stock plunge the 'Gentlemen's Crash'?"
Squire, before your time, we had a single day back in '87 wherein the S&P closed down by better than 20%. The combined 5.2% loss of Thursday/Friday, if not the aforementioned 5.8% for the week, pales in comparison. As for the "speed" of the S&P futures, (which we liken to that of a car on an autobahn), the median daily speed year-to-date through Thursday was 163kph; then yesterday the speed accelerated up to 804kph. That's super fast, (about a 1-point change in the S&P futures every 30 seconds as opposed to the median of 1 point about every 2 1/2 minutes), but remains slight compared to what we saw when we had multiple days well into the 1000kph zone during the Black Swan of 2008. (The record we have from 08 October 2008 is 6,345kph = 16 S&P points per minute, an unforgettable and truly frightening trading session!) Thus given the current percentage changes and speed, we view today what really is only a "correction" to this point as a civil "Gentlemen's Crash". Might I press you to a cucumber sandwich?
Nonetheless, in full force is the media hype, their being more influenced by points change rather than by that of percentage. The radio station France Info made reference to "une chute spectaculaire de Dow Jones" Oh shoot, Gaston, 'twasn't that bad. Losing 500 Dow points down into the 16,000s is minuscule compared to having lost 500 Dow points into the 1,600s back on 19 October 1987.
Still, with respect to money management, I've periodically asked both friends and investors what their well-compensated advisors are prepared to do should the S&P futures overnight go "limit down", (to which as yet they've come nowhere near). At first I hear crickets, followed by a mumble, and then a change of subject. In this age of selfies and a stock market thought to be a savings account, equities corrections aren't suppose to happen.
But now a material one seems to have begun, and as a prescient investing banking colleague wrote to us this past week prior to it all going wrong (verbatim): "...qe is coming to the us again, just not for awhile. Then one can buy gold as the only remaining central bank..." A few words from the wise are sufficient.
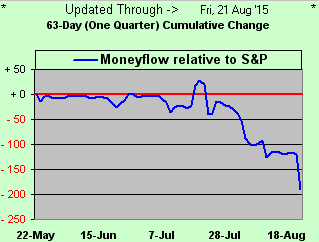
One more brief graphic with respect to the stock market and then we'll go with Gold for the duration of this piece. If you peek in at the website, you're perhaps familiar with our daily updating of the stance of the S&P 500 versus its moneyflow, (which we regress into S&P points). The blue line in the chart below suggests that based on monetary outflow from the Index over the last 63 trading days (one quarter), the level ought be almost 190 points lower that 'tis right now, (i.e. rather than at the present 1971, instead at 1781, which from the all-time high of 2131 would encompass a "Gentlemen's Crash" of -16%). That tells us ahead are more shocks for stocks:
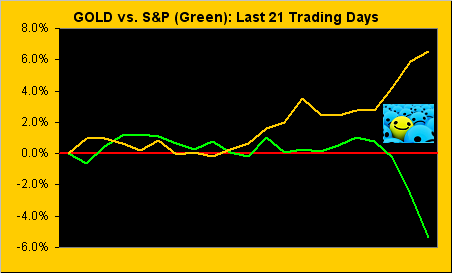
So as we segue into gold, here is its percentage track for the last 21 days vis-à-vis that of its now long gone dancing partner, the S&P:
Next, with respect to the two technical measures mentioned earlier toward ascertaining that gold's bottom is in, first we have price versus its 300-day moving average, presented on this anniversary from the all-time closing high of 1900.4 four years ago-to-date. The key here is to initially get back above the moving average and then in due time have the average itself return to rising...
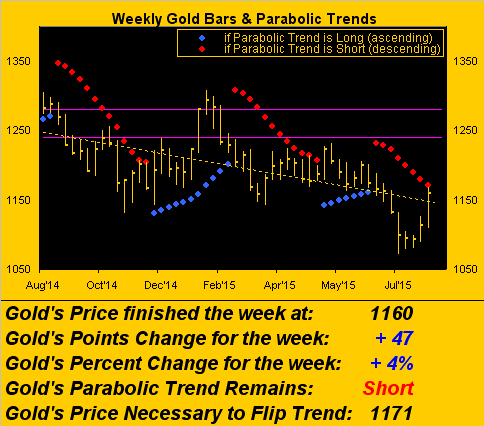
...then second to have gold clear the 1240-1280 resistance zone as bounded by the purple lines in the below chart of the weekly bars. And as price closes in on the declining red dots toward breaking through them to flipping the parabolic trend to long, (which from here at 1160 requires just 11 points to 1171), this past week was gold's best percentage weekly performance since that ending 16 January and moreover, the third best one in over two years (since the week ending 16 August 2013):
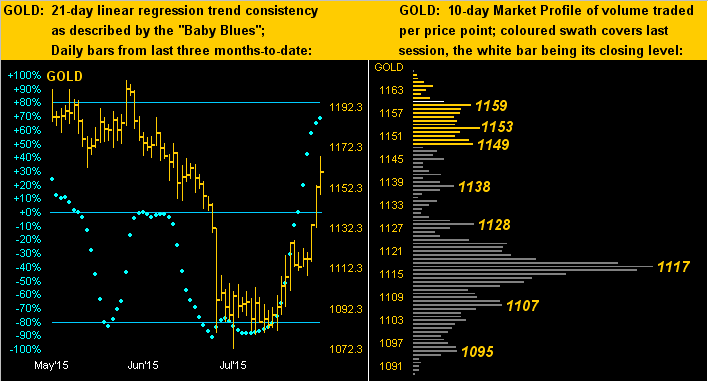
Finally in the following two-panel graphic, on the left we've gold's daily bars for the past three months, the "Baby Blues" that depict the consistency of 21-day linear regression trend all but having reached +80%, the level at which the uptrend becomes confirmed as being firmly intact. And on the right we've gold's 10-day market profile, every price label thereon being near-term support. Bearing in mind that the present price of 1160 is an ever so lowly level, the combined graphic is still a beautiful anniversary gift:
In wrapping it up for this past week - not that it matters which snowflake started the equities avalanche - but 'twas not so much China's yuan week-earlier devaluation flake that set things a-tumblin', but rather, (if not for simply coincidental timing), 'twas instead Thursday's touch upon the snow of Kazakhstan's now freely-floating tenge, something with which we've no familiarity, let alone knowledge of how to pronounce. Nevertheless, upon the tenge going "ting", the bonding snowflakes succumbed to gravity, making for riveting media madness through the balance of the week.
And thus as we look into this week, "weak" being the operative word for China, Japan, Europe, the US and elsewhere, come Thursday (27 August) we receive the first revision to Q2 GDP: initially reported as +2.3%, 'tis now expected to be upped to +3.1%. Not so sayeth the econ baro! So stayeth with gold.