Lately, I’ve been writing about selling options in bear markets. No surprise here as the market is down about 10% in the past three months. This, of course, is challenging for all investors but manageable to those who have achieved the three required skills for option-selling (stock selection, option selection and position management). Market conditions will dictate and give direction as to the type of securities best-suited for our current portfolios and the most appropriate strike prices to use.
In the past several weeks we have seen the re-appearance of gold exchange-traded funds (ETFs) onto our Premium ETF Reports. Even in bear and volatile markets, there are always securities that perform well and it is imperative for Blue collar Investors to locate these underlyings.
Gold ETFs and implied volatility
Here are the three gold ETFs and their associated implied volatility that earned their way onto our Premium ETF Watch List on 2/10/2016:
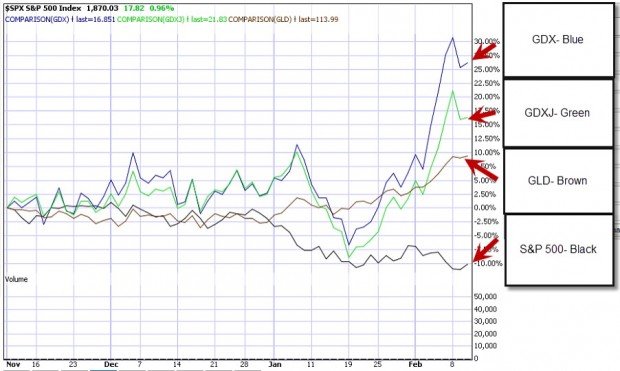
Performance chart of Gold ETFs compared to the S&P 500 (3-month chart):

Gold ETFs vs the S&P 500
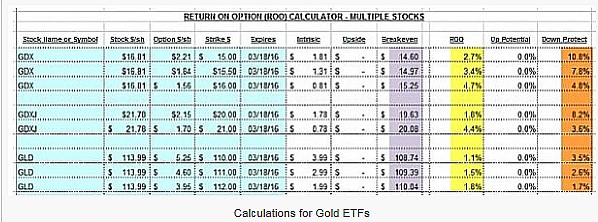
With the S&P 500 down about 10% over the past three months, the gold ETFs were up between 10% and 27%. The overall implied volatility of the S&P 500 at the time was 24.14. Before even checking option chains we know that GDX and GDXJ are much more volatile and therefore riskier than GLD. They also should generate higher premiums than GLD. Since we are presuming a bear market environment, I selected only in-the-money strike prices. Here are the calculations generated by the Basic Ellman Calculator:

- Yellow field: Time value returns (intrinsic value deducted)
- Brown field: The amount of downside protection of the option profit (not breakeven)
- Purple field: The breakeven point, below which we start losing money
Results of calculations
GLD produced the lowest option profit returns and smallest downside protection of those profits. Because GLD had the lowest implied volatility, this is what we expected. Conservative investors with low risk-tolerance may prefer the GLD $111 strike which generated a 5-week return of 1.5% (time value only) which was protected by 2.6% on the downside. More aggressive investors may opt for the GDX $15.50 strike which generated a 5-week time return of 3.4% which was protected by 7.8% to the downside. I created the Ellman Calculator to assist us in making the best investment decisions based on our personal risk tolerance and overall market assessment.
Discussion
Gold ETFs may represent an investment opportunity in certain bear market environments. We must be diligent in evaluating the risk incurred in our trades to make sure that risk matches our trading style and personal risk-tolerance.
Market tone
After two positive weeks, stocks had a difficult week, with bank stocks among the worst-performing. Investors are troubled that negative interest rates and other monetary policies have not been effective and that central bankers will have no tools left if economies head in the direction of recession. The Chicago Board Options Exchange Volatility Index (VIX) rose to 25.5 from 22 last week. This week’s reports were mostly positive:
- US January retail sales rose a better-than-expected 0.2%, and December sales were revised up to 0.2% from the previously reported -0.1%
- During her semiannual monetary policy testimony to Congress, US Federal Reserve Chair Janet Yellen said that the Fed was quite surprised by the movements in oil prices and the extent of the dollar’s strength. She did not rule out the possible use of negative interest rates
- Yellen said it is premature to say a recession is probable, despite the fact that global financial and economic developments reflect negatively on the US economic outlook
- A Wall Street Journal survey of economists and CEOs showed that the odds of a US recession in the next 12 months have risen to 21% from around 10% at the end of 2015 mainly due to global concerns
- Despite chaotic financial markets and growing recession fears, US weekly jobless claims showed no signs of trouble for the US labor market
- Initial claims for unemployment benefits fell 16,000 to 269,000, not far from the post-recession low of 256,000
For the week, the S&P 500 declined by 0.82% for a year-to-date return of – 8.77%.
Summary
IBD: Market in correction
GMI: 1/6- Sell signal since market close of December 10, 2015
BCI: After two positive weeks, we had a down week of a bit less than 1%, confirming that the market has yet to establish a firm bottom. Friday’s rally was a positive as was the consistent bounce off the S&P level of support at 1812. 1/3 of my stock investment portfolio remains in cash short-term. Favoring only deep out-of-the-money puts and in-the-money calls on active positions.
