'Tis been a fair number of weeks since we first anticipated that gold soon wouldn't be "in Kansas anymore", only to then see price become mired in the Whiny 1290's for better than a month as if in "Neverland" with price never going anywhere. Not anymore.
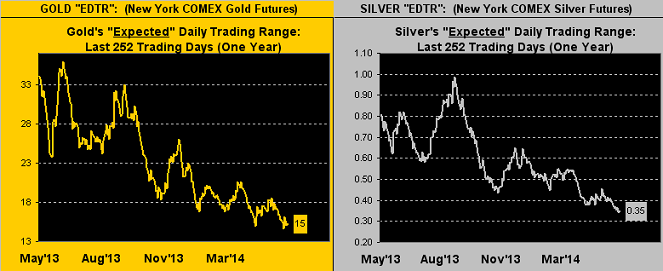
The main southward route out of Kansas, (or if you prefer, "Neverland", as unless 'tis your beloved home, you'd likely never go there), is Interstate 35, as it cascades down through such notable gun-slingin' outposts as Oklahoma City and Dallas to terminate on the north bank of the Rio Grande, just across from Mexico's Nuevo Laredo. Perhaps not the world's most favourite destination, but with respect to gold, we're actually heartened to have at least departed those Whiny 1290s, regardless of direction, for finally we're going somewhere. Indeed the expected daily trading ranges ("EDTR") for gold, and moreover for silver, have been narrowing to practically nothing over a year's time:
Later in this missive you'll find the Gold Stack, a definitive listing of the myriad of price levels deemed to be important milestones for gold to either survive on the downside, and in due course to surpass on the upside. One such area of structural support is that to where gold has just arrived: 1280-1240, a zone comprised of concentrated trading following the period of turmoil that led into June a year ago, which then failed in ending the year, only to be recovered in the new year as price spent the first six weeks of 2014 therein banging about. Now here we are yet again, the 1280-1240 zone bounded by the two horizontal lines on the following chart of gold's weekly bars and the nine-week running parabolic short trend:
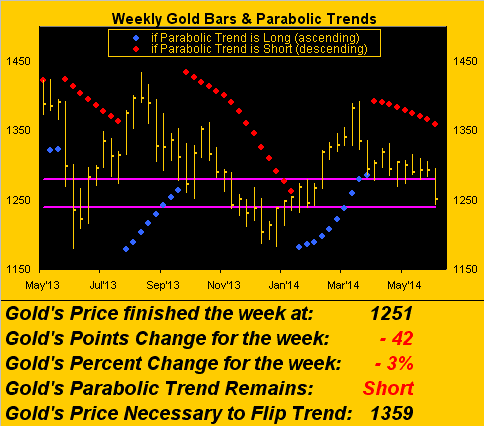
We'd prefer to be heading northward, but if anyone can find positives in a down market, 'tis humbly ink-slingin' yours truly. And the one thing about gold's dip this past week that I noticed was that nobody noticed. The nattering nabobs of negativism that lurch out of the shadows whenever gold produces a notable down day have been, from what I've seen, nowhere to be seen. Indeed barring one's having tracked price this past week, one might suppose gold to still be stuck in the Whiny 1290s. Nary a gloating FinMedia peep did I hear nor read about, "Oh there it goes! Down again!". Might that be due to Citi's (NYSE:C) seeing the mid-1300's next year? Or Morgan Stanley's (NYSE:MS) having put an "overweight" buy rating on our roller-coaster favorite Royal Gold (NASDAQ:RGLD), (see final chart herein)? Or perhaps the portent of some prognosticators for the dollar's collapse in just a month's time?
Most admittedly there's doubt (understatement) for my target of 1466 being reached by this mid-year. With gold currently at 1251, we've but the 21 trading days of June to ascend the 215 requisite points to achieve 1466, although such span-per-days has occurred in the past. Indeed during 2011 in the 21 trading-day run from 22 July to 22 August, gold rose by better than 300 points. Or from the percentage purview, 1466 is 17% higher than the current 1251 level, an increase that has been accomplished by gold over 21-day periods in 2006, 2008, 2009 and 2011. Unlikely this time 'round, yes. (Impossible no, although the notion for a 2014 high of 1529 with 149 trading days remaining in the year remains quite viable, and in fact modest to the most ardent of gold bulls.)
Am I worried about gold's having slipped to here? Hardly. If "nobody" owns it now at $1,251/oz., what might price be when "everybody" owns it? The notorius estimate of $50,000/oz. nothwithstanding, I oft think were one to approach the most ardent of gold bears and wager them that gold shall in time exceed $2,000/oz., given an ounce of common sense, they wouldn't take the bet. Whilst 'tis currently très cool to be gold-negative, the natural evolution of rising populations, surging sovereign debt levels, and ongoing currency debasement means 'tis only a mere matter of time 'til gold achieves $2,000/oz., and methinks far sooner than later. Hang on to your gold.
Of course, one catalyst to get it all going would be the reversal of this:
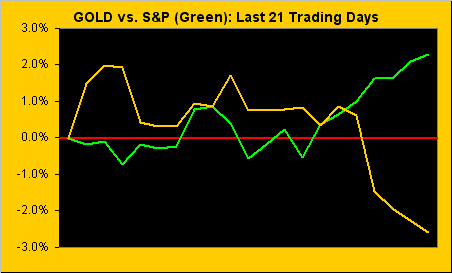
Gold and the S&P 500 remain quite the counter-directional markets to one another. The S&P (p/e 30.7x, yield 2.021%) continues to make marginal all-time highs on puny volume: the daily average number of futures contracts traded from 17 March-to-date is 1,562,143. The daily average for this past week alone was only 931,988. We've illustrated in the past the coyote's having run well beyond the cliff into orbit; clearly he's moved on to outer space. Unsustainability is one thing; lunacy is dangerous. And all within the context of the burgeoning Bond 'tis irrefutably NUTS! (technical term).
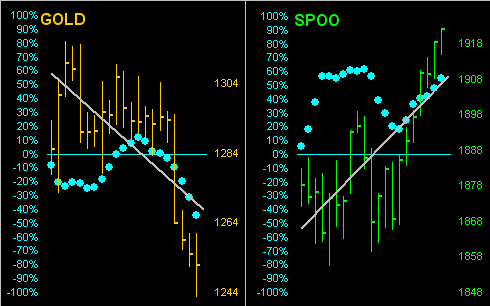
Here are the same 21-day spans for gold and the S&P with their respective diagonal linear regression trendlines and "Baby Blues", the dots indicative of improving trend consistency to both gold's downtrend and the S&P's uptrend:
"But for the S&P it's like yer still totally on crash-watch, huh mmb..."
'Tis worse than that Squire-dude, and we've said it before: were the S&P to take a 50% haircut (from 1924 to 962) and the P/E be halved to 15x, the index still would be pricey, (unless that which they taught us in "Biz-School" was "BS").
Still, we have to face the fact that in the year-to-date BEGOS Markets Standings, gold has fallen from first place to fourth:
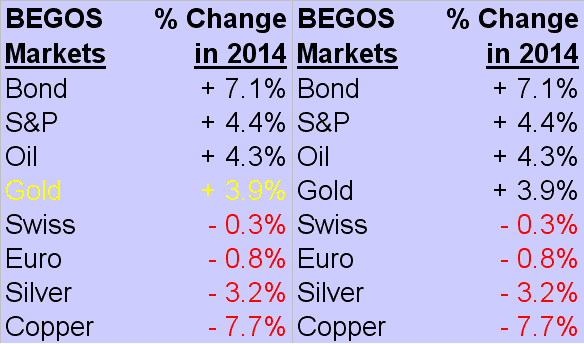
But what is beyond bizarre therein is Sister Silver's being down -3.2%. If adorned in her precious metal pinstripes, ought she not be up as is gold (+3.9%), or if adorned in her industrial metal jacket be up as is the S&P (+4.4%)? Rather, she appears to have succumbed to the wicked ways of Le Rouge: Dr. Copper (-7.7%). Hang on to your silver.
Specific to gold, with the notion that the week's skid out of the Whiny 1290s into the 1280-1240 support zone may already be a bit overdone, here we've a two-panel chart of daily closes for the past three months-to-date. On the left is gold vis-à-vis its valuation, (price's movement relative to those of the other primary BEGOS markets); the smooth pearly line "suggests" gold ought instead be just above 1300, the chart's oscillator showing deviation by price being "as low it goes", (acknowledging that in the 2013 selling panic we saw deviation by almost -250 points). On the right is gold vis-à-vis its Market Magnet, (the number in the box), with that chart's oscillator showing the price to be some 28 points below the Magnet:
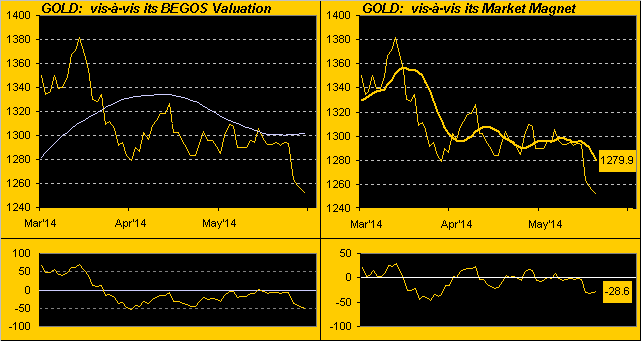
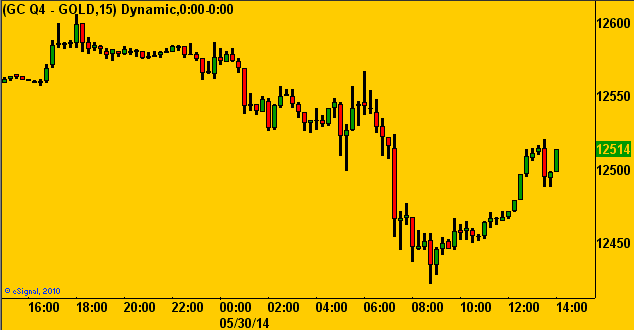
Therefore, in not expecting the week's pullback to be the start of a savage selloff similar to that of a year ago, we instead view gold's southern drive as but a provisional peregrination to test the support of this 1280-1240 zone. Indeed per the following chart of gold's 15-minute bars for Friday's full 24-hour session, you can see that price having tested the lower end of that zone, buyers then returned during the final six hours of trading from 08:00 Pacific Time to the 14:15 close:
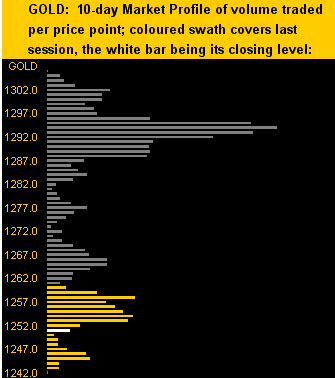
With that week-ending buy surge in mind, here's the shape of gold's 10-day Market Profile, Job One being to get back above its 1253-1258 trading clump:
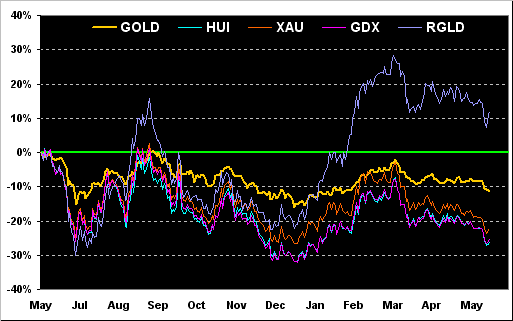
And as 'tis month's end, here we've the year-over-year percentage tracks of gold, the Gold Bugs Index ARCA Gold BUGS (HUI), the Philly Exchange Precious Metals Index Philadelphia Gold/Silver (XAU), the exchange-traded fund for the miners (Market Vectors Gold Miners (ARCA:GDX)), and the aforementioned royalty company Royal Gold:
Finally, to the Gold Stack we go:
Gold’s All-Time High: 1923 (06 September 2011)
The Gateway to 2000: 1900+
The Final Frontier: 1800-1900
The Northern Front: 1750-1800
On Maneuvers: 1579-1750
The Floor: 1466-1579
Le Sous-sol: Sub-1466
Year-to-Date High: 1392
Base Camp: 1377
The Weekly Parabolic Price to flip Long: 1359
The 300-day Moving Average: 1329
10-Session directional range: 1306 down to 1242 = -64 points or -5%)
Neverland: The Whiny 1290s
10-Session “volume-weighted” average price magnet: 1280
Structural Resistance: 1269 / 1280 / 1479 / 1524-1535
Trading Resistance: 1253-1258 / 1266 / 1277 / 1294 / 1302
Gold Currently: 1251, (weighted-average trading range per day: 15 points)
Trading Support: 1245
Structural Support: 1240 / 1227 / 1163 / 1145
Year-to-Date Low: 1203
In closing, here are two key items of so many to be assessed this week:
1) Expectations are rife for the European Central Bank's Governing Council to vote on Thursday for further eurozone stimulus. Yet as the larger member nations are losing their economic traction, 'tis perhaps to Little Latvia they ought look for some monetary moxie, the wee member nation having just had its S&P credit rating raised due to a “strong” economy and improving public finances. The country's entire population may be only half that of the bankruptcy-flirting City of Los Angeles, but clearly the Baltic Baby's house is in order, (and there are no Dodgers);
2) Bringing up the rear of an ample dosage of incoming data shall be Friday's release of expectedly-lower May job creation coupled with a higher rate of unemployment. Again: mind the Economic Barometer at the website as we glide toward the 18 June policy announcement by the Federal Reserve Bank. Might the taper be tempered by at least talk? Gold ought respond quite positively to both such central banks' follies!