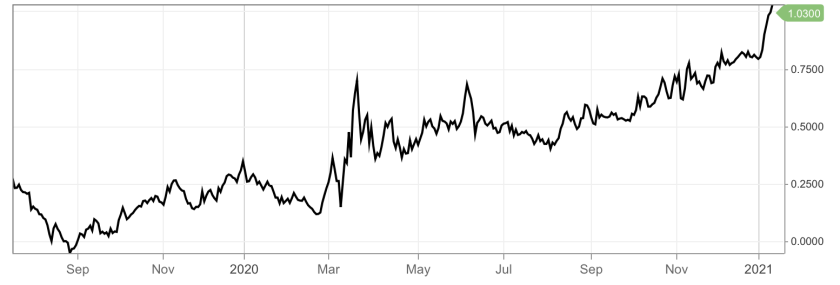
Another week, another yield curve steepener and continuation of the trend that began in August, 2019.


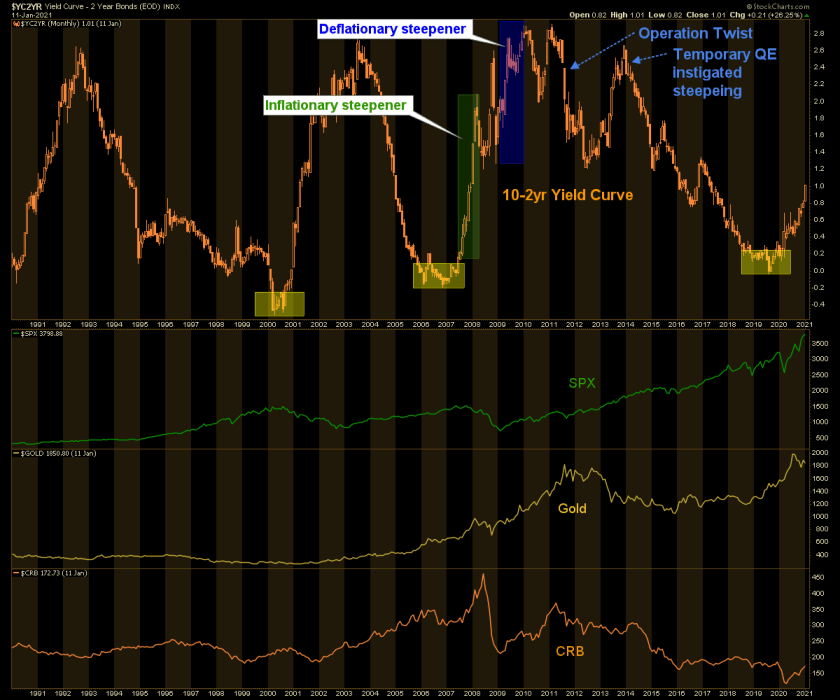
Flipping to the bigger picture I added in the S&P 500, Gold and the CRB commodity index to the 2-year/10-year yield curve chart below for reference. With the levels of MMT TMM (total market manipulation) injected in the markets since Ben Bernanke cooked up the diabolical macro manipulation known as Operation Twist I can’t pretend to quant the past to the present…

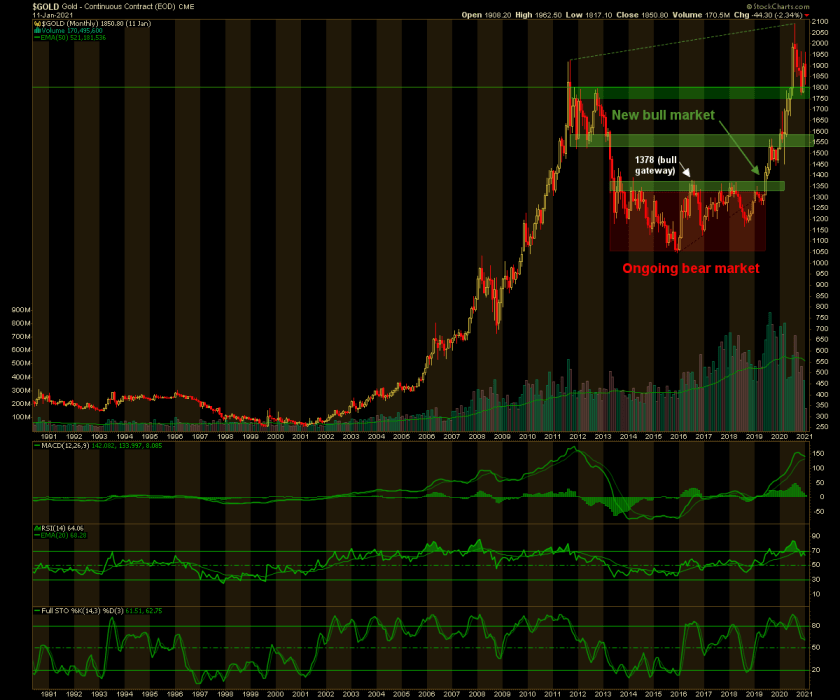
…but one observation above is that gold is in a giant and bullish Cup with the Handle—as anticipated since the correction began from a higher high last summer, still in process. That's referencing this November post.
Here is the updated chart from that post. It always was going to be an extended grind to put in a proper Handle on this monthly chart. Gold is doing good work and it is doing it in a preferred (i.e. not Goldilocks) environment. Goldilocks is a product of a flattening yield curve’s boom, and a steepening yield curve is either inflationary bullish or deflationary bearish. Or as per the last cycle, both.
This is definitely not Goldilocks, which not coincidently attended gold’s bear market every step of the way.

