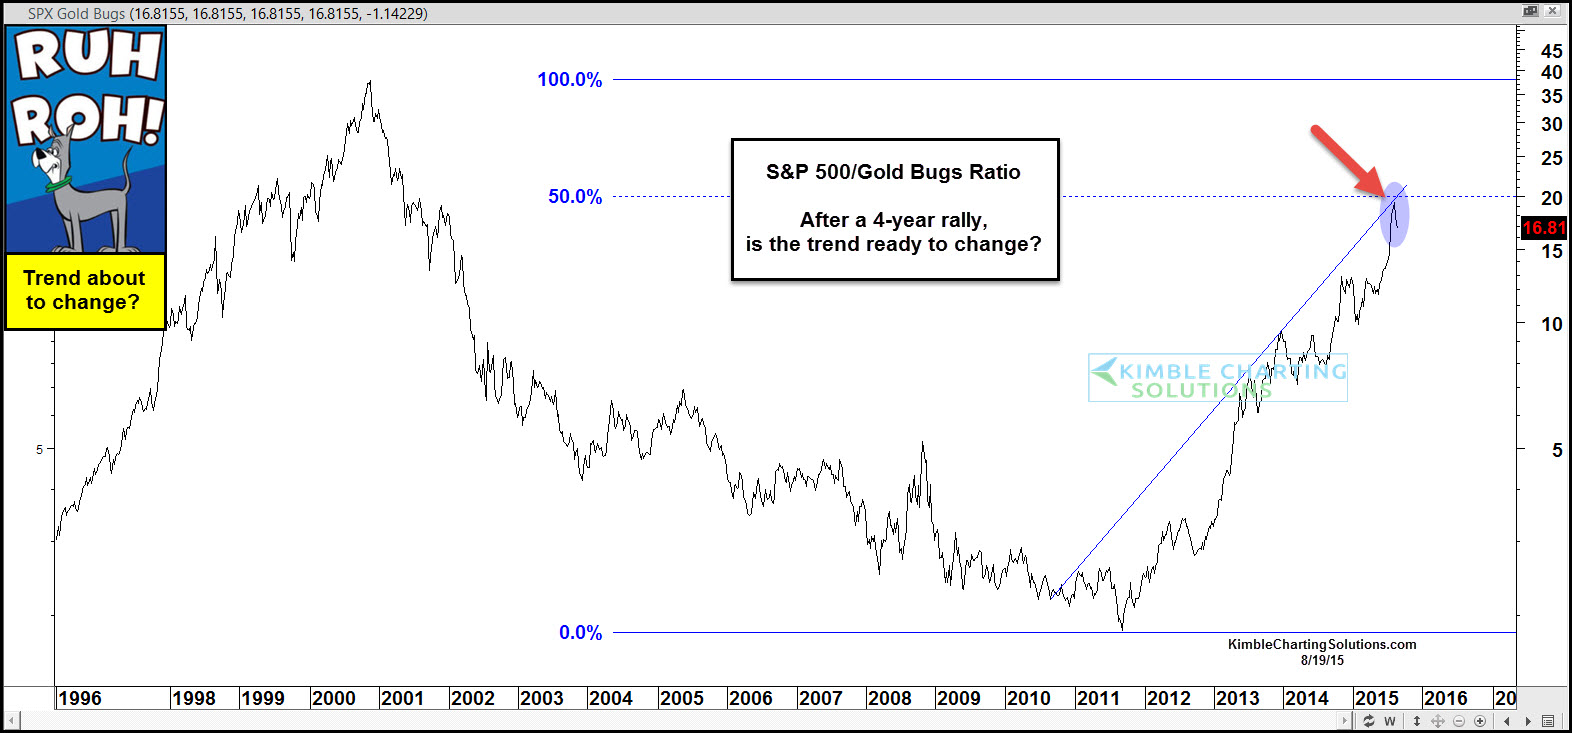
This chart looks at the S&P 500/Gold Bugs ratio over the past 20-years.
As you can see, the ratio trended lower from 2000 to 2011, reflecting that the Gold Bugs index was stronger than the S&P 500 for over a decade.
Over the past 4 years the opposite has been true as the S&P 500 has been much stronger than gold stocks (S&P has done well since 2011 and the Gold Bugs index is down nearly 70%).
Is a change of trend about to take place in this ratio?
Recently, the ratio hit the 50%-retracement level of the 2000-2011 decline and a steep rising resistance line. At this point, one can NOT say the trend has changed -- because it hasn’t.
What would one look for to see if this trend is truly changing? I would look for this ratio to break support and if the GLD/SLV ratio and the GDXJ/GDX ratio (shared with metals members each week) also breaks support at the same time, odds ramp up that a trend-change in the hard-hit metals complex is changing.

