It’s the ultimate “no-brainer” that serious American GDP growth (in the 6% range or higher) can only happen by eliminating the PIT (personal income tax) for the middle class.
QE and low interest rates incentivize pathetic levels of debt-oriented GDP growth while incentivizing the government to get more reckless with the money that is borrowed and extorted from citizens as taxes.
Elimination of the PIT would instantly turn the debt-bombed middle class of America into a “savings and purchasing power machine”.
With higher rates and elimination of the PIT, government would be forced to shrink, banks would eagerly loan out the savings to mainstream business, and the middle class would consume with savings rather than credit card debt.
The bad news: The PIT won’t be eliminated, and government worship of debt, QE, low rates, and extortion is not going away.
The good news: That means the gold price is going higher.
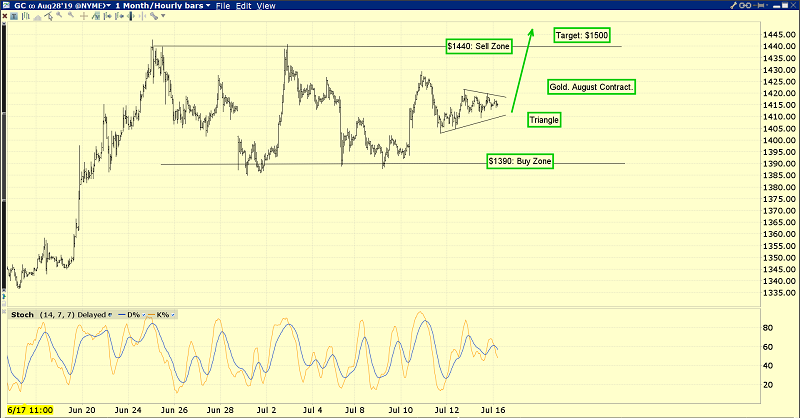
The key buy and sell levels for gold.
Gold investors should be eager buyers of gold, silver, and the miners in the $1390 gold price area or on a breakout above $1440.
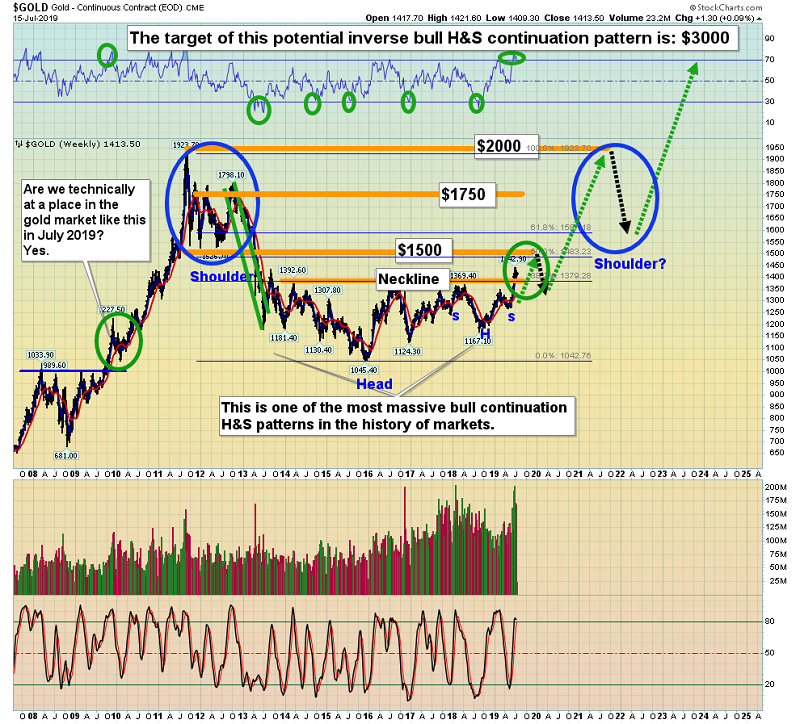
This is the key weekly gold chart.
The most likely scenario for gold now is a rally towards $1500-$1523, followed by a significant pullback that will probably look a lot like the late 2009 pullback.
What actually happens is almost certainly going to depend on the actions and statements from the Fed at the July 31 meeting.
If the Fed isn’t as dovish as expected, gold could pullback towards $1320 quite quickly. A half point cut and a dovish outlook could produce a dramatic “target overshoot” for gold. A surge to $1750 would be quite realistic in that situation.
Whatever happens, $1390, $1360, and $1320 are all key buy zones and $1440, $1500, and $1750 are all decent profit booking targets.
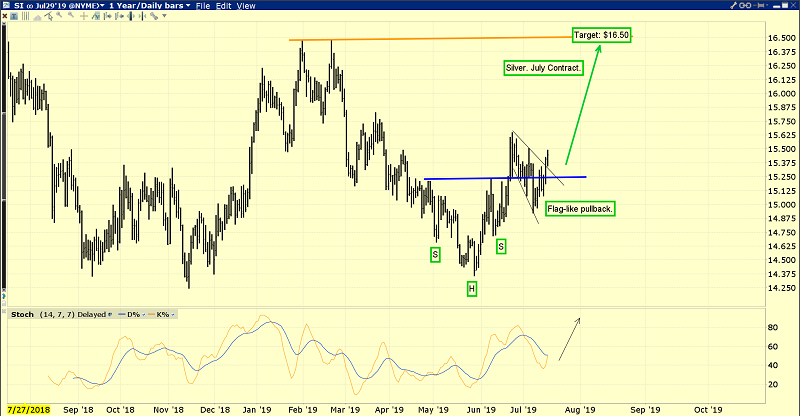
This is the daily silver chart. Like Rodney Dangerfield, silver doesn’t get much respect, but that’s because inflation has yet to really surge.
Having said that, the silver chart is beginning to look quite bullish. A breakout from an inverse H&S bottom pattern has occurred, and the pullback was flag-like.
The target of both the flag and the H&S pattern is the $16.50 area highs of February.
From a risk-reward perspective, silver is beginning to look superior to the US stock market.
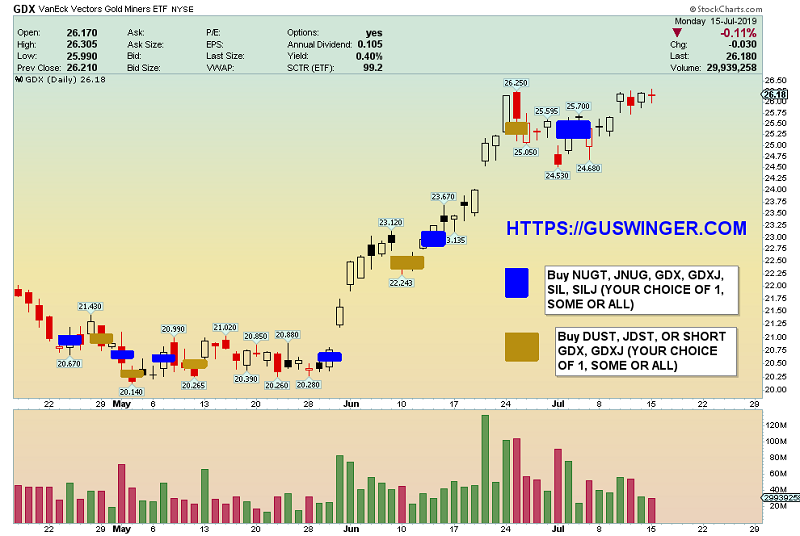
This is the swing trade chart.
Swing trade enthusiasts can get in on the leveraged ETF action for gold stocks and the Nasdaq with my guswinger.com service. We are also carrying a massive Barrick (NYSE:GOLD) position. Signals are available by email (and cell phone text for traders with US cell phone numbers).
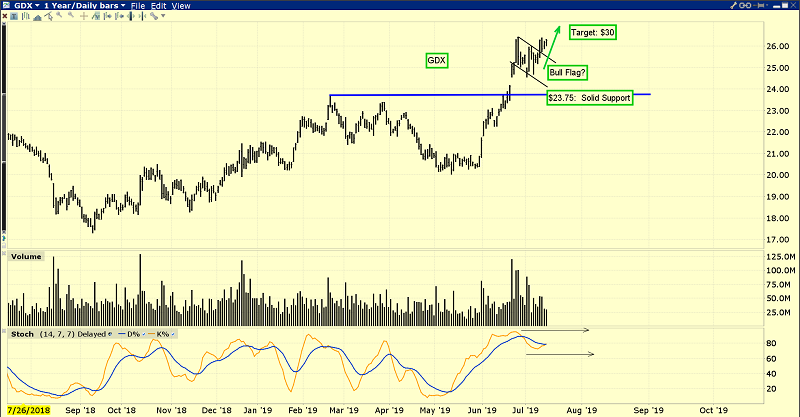
An analytical look at the VanEck Vectors Gold Miners ETF (NYSE:GDX) daily chart. I use a 24hour chart for GDX. On this chart, a surge above $26.45 would be a fresh buy signal not just for GDX, but for most intermediate and senior gold producers.
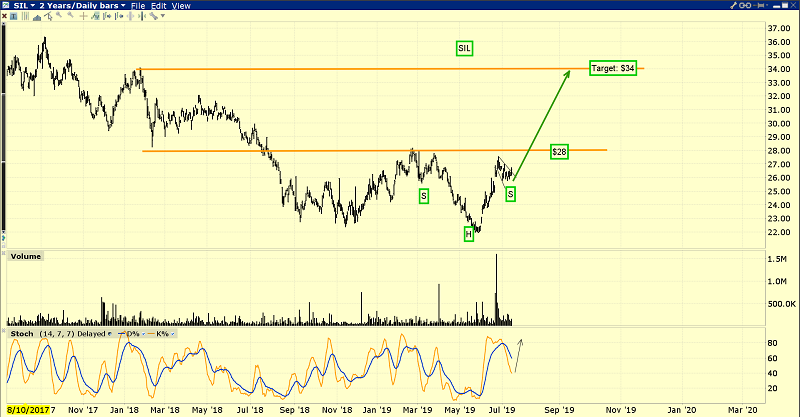
This is the silver stocks ETF (NYSE:SIL) chart.
Note the recent superior performance of the silver miners compared to silver bullion.
There is an H&S bull continuation pattern forming on the chart and I believe that pattern makes an “upside blast” to my $34 target price zone highly likely.
The bottom line for gold and silver stocks: The action is solid, and the action is now!
Stewart Thomson is a retired Merrill Lynch broker. Stewart writes the Graceland Updates daily between 4am-7am. They are sent out around 8am-9am. The newsletter is attractively priced and the format is a unique numbered point form. Giving clarity of each point and saving valuable reading time.
Risks, Disclaimers, Legal
Stewart Thomson is no longer an investment advisor. The information provided by Stewart and Graceland Updates is for general information purposes only. Before taking any action on any investment, it is imperative that you consult with multiple properly licensed, experienced and qualified investment advisors and get numerous opinions before taking any action. Your minimum risk on any investment in the world is: 100% loss of all your money. You may be taking or preparing to take leveraged positions in investments and not know it, exposing yourself to unlimited risks. This is highly concerning if you are an investor in any derivatives products. There is an approx $700 trillion OTC Derivatives Iceberg with a tiny portion written off officially. The bottom line:
Are You Prepared?
