Investing.com’s stocks of the week
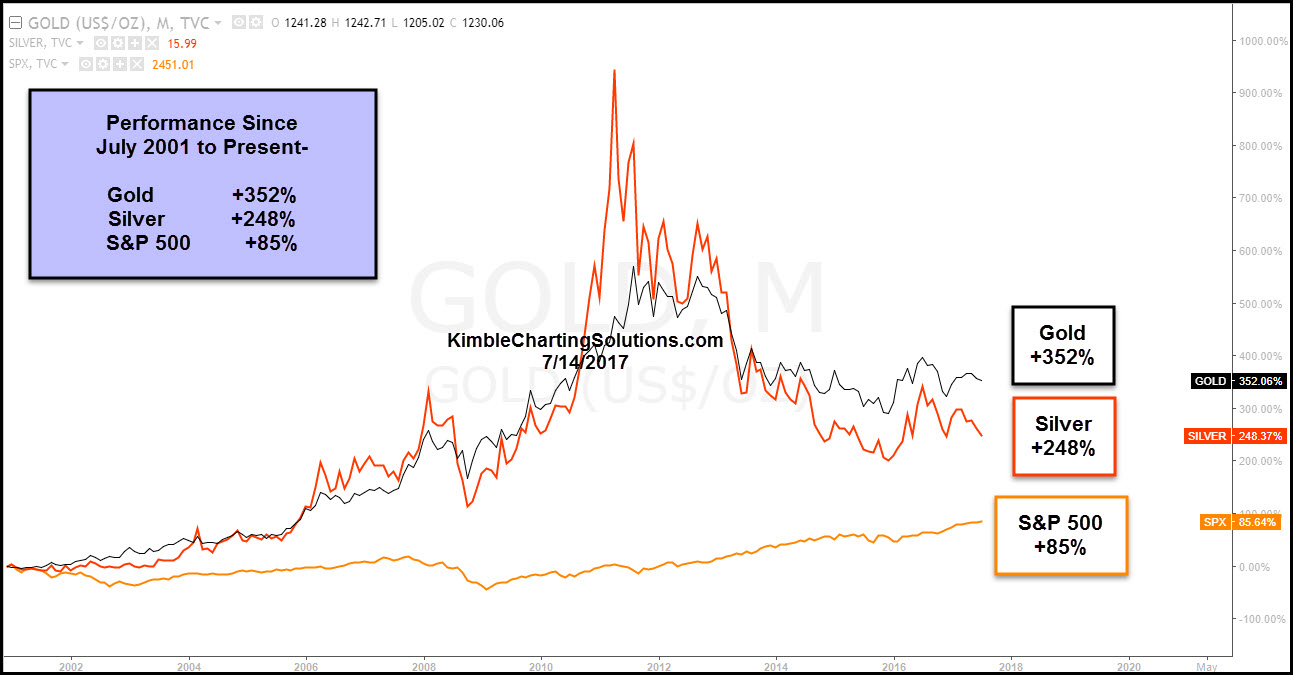
The chart below compares the performance of gold, silver and the S&P 500 since July of 2001. Why start back in 2001? That's when gold and silver created a series of higher lows, starting a new bull market that lasted into the following decade. Between 2001 and 2011, gold and silver outperformed the S&P 500 by more than 500% per metal.

It certainly paid to own the precious metals over the S&P 500 between 2001 and 2011. As we all know, the performance between the three has done the exact opposite over the past 6 years, when it paid to own the S&P 500 and avoid gold and silver. Is it time to consider that gold and silver may be ending the 6-year bear market in metals?
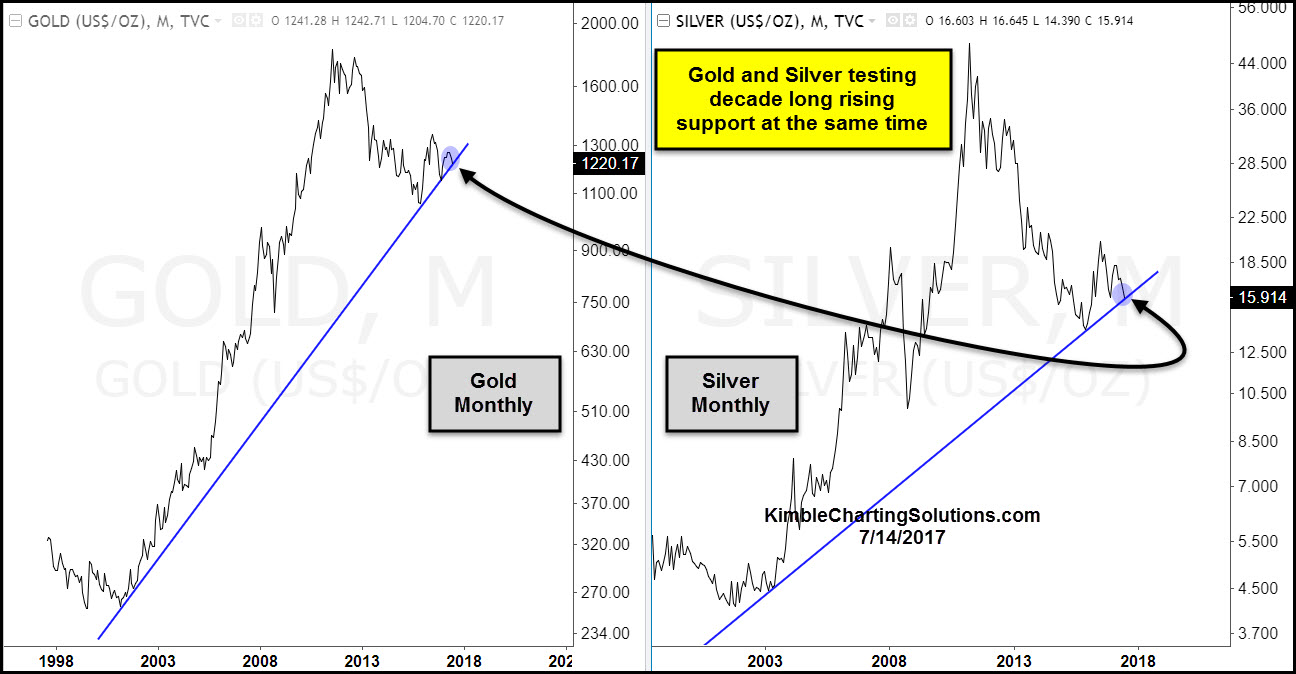
Below looks at just gold and silver since the late 1990s, revealing why prices are testing what could be historically important levels.

The above chart shows that gold and silver on a monthly basis are each testing 16-year rising support. Despite their recent 6-year down performance, gold & Silver are now in long-term rising trends, where support is being tested.
Support is support until broken and both metals are testing long-term support at this time. What both do at this support test should send very important long-term messages about the metals space, leading to wonderful opportunities.
