The more wobbly becomes the world, the more warranted becomes the ownership of Precious Metals. Dare we say: "Stop the World – I Want to Get Off" --(Bricusse/Newley, '61) ... whilst taking along both gold and silver. Indeed Sister Silver, come flee with me! For in 2016, now halfway, plus a day, 'tis silver that is running away, as we see per this year's BEGOS Market Standings through Friday (yesterday):
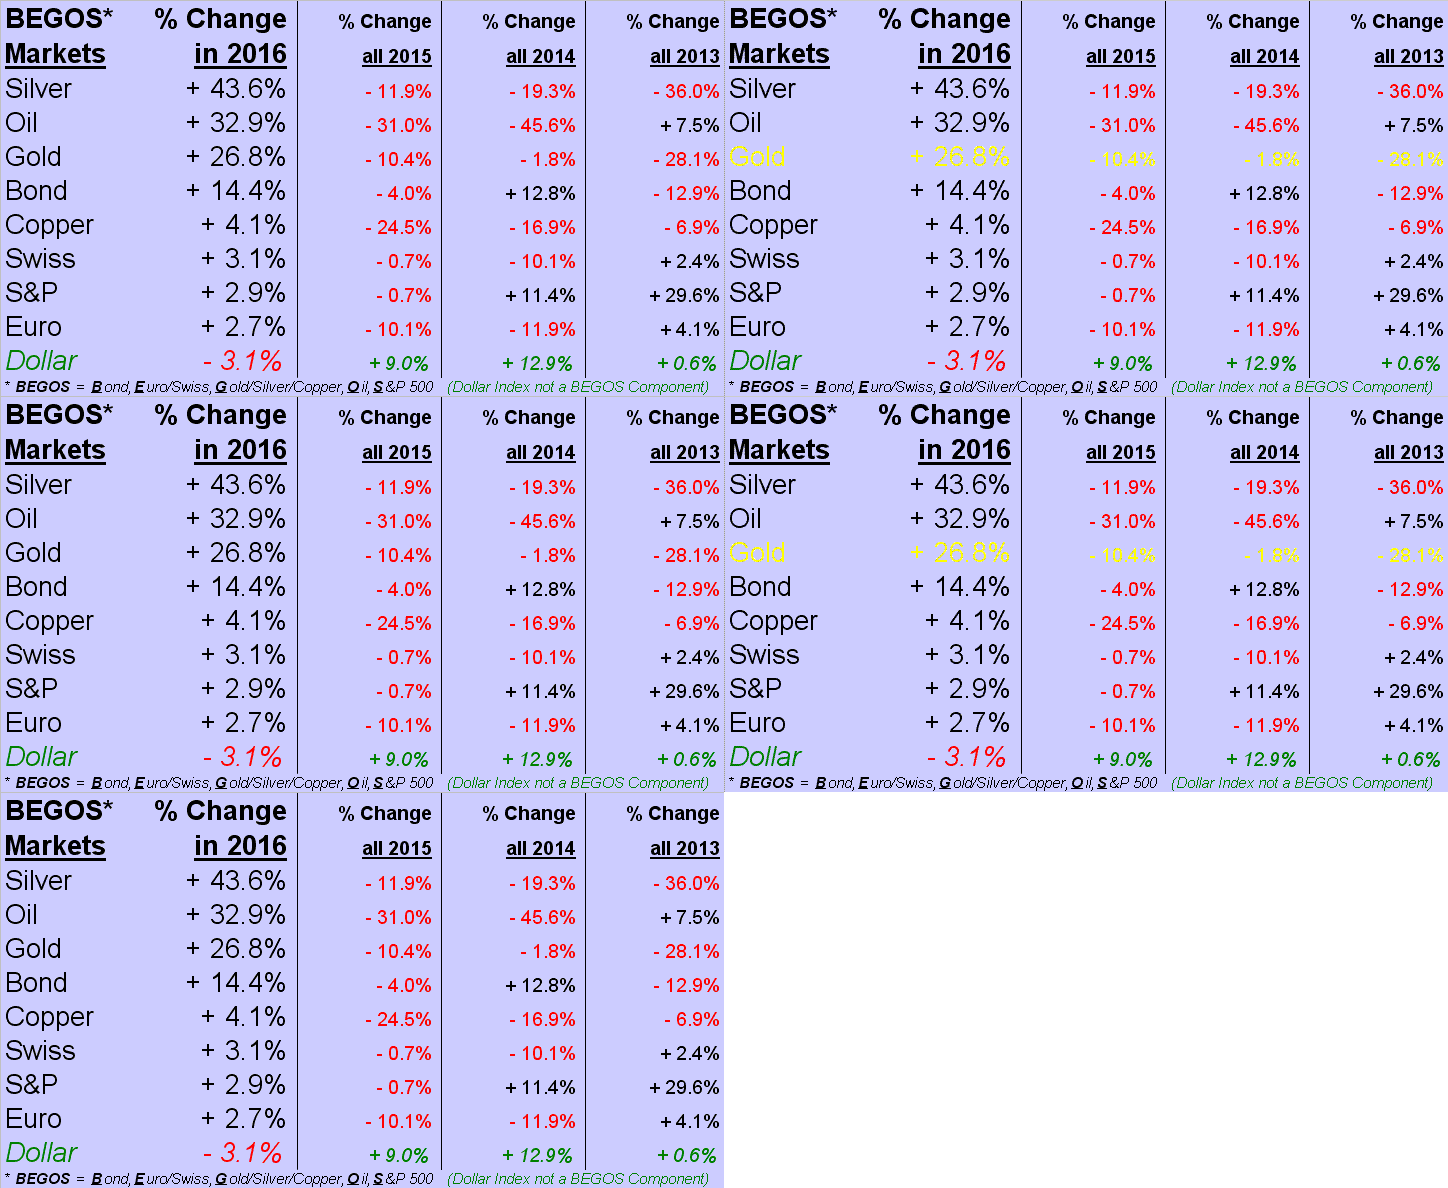
Oh how, per the above year-to-date standings, is that white metal rockin'! And if hopefully you've been stackin' some, as sang Keith Richards in "You Got The Silver" --(Stones, '69), it'll buy some time, and in due time, a lot more than the folded fibrous paper in your pocket, or ostensibly, what you think your bank "owes you" should you wish to withdrawal that which you've deposited; (as long as you don't ask for your rightful share at the same time everyone else does). Or, as we're wont to say: "If everyone sold all their stock today, everyone would receive ixnay."
And speaking of stock, if that's all you've got, you might query: "Did Brexit actually just go for naught?" For stocks have come all the way back, thanks a lot. Crazy, eh? Or perhaps not, pending central banks' printing to maintain the upshot. Indeed, saved again is the Great American Savings Account, as described below by the red line (S&P 500) vs. the blue line (Economic Barometer), from one year ago-to-date:
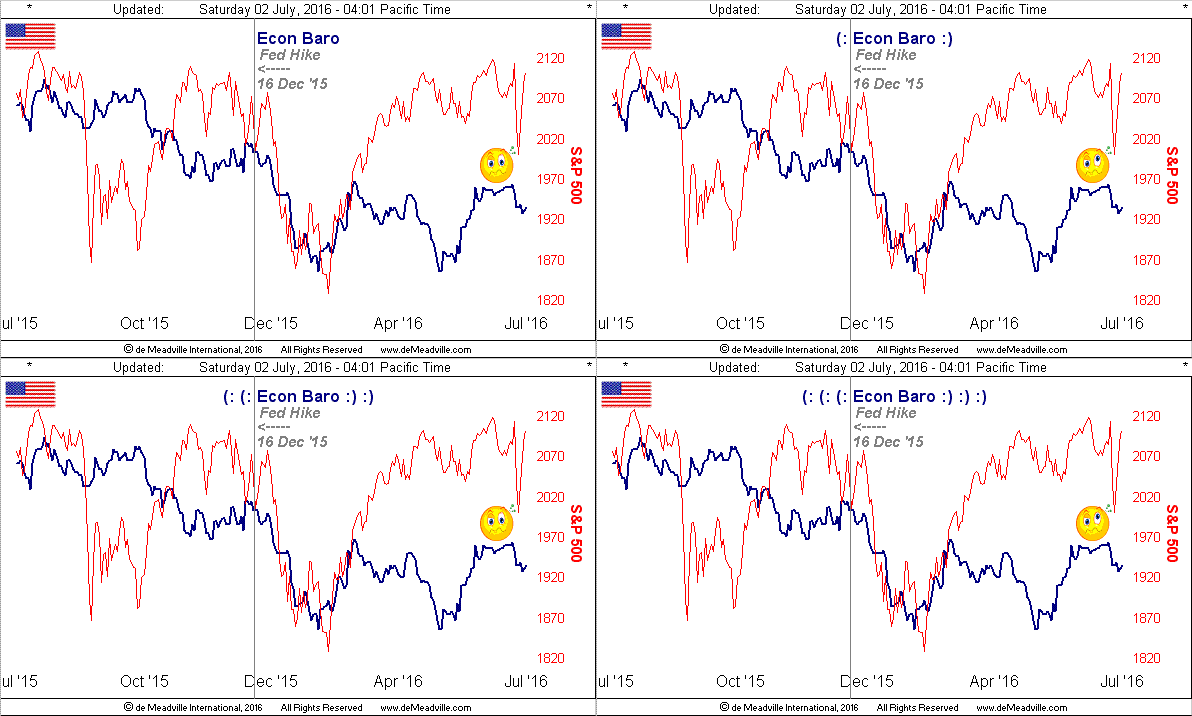
To view the stock market's stunning recovery, yes one might opine that Brexit's vote never happened; 'cept that the Precious Metals did not revert back lower from whence they came pre-Brexit, (recall gold having drifted down to 1253 and silver to down to 17.11 as Nigel Farage prematurely threw in the towel). But Mama, look at 'em now, gold having settled out the week at 1345, (its highest close since 18 March 2014), and Screamin' Sister Silver at 19.85, (her best settle since 14 August 2014). Here are the weekly bars for the yellow metal, the parabolic Long trend (rightmost blue dots) just three weeks young; note as well that the purple-bounded 1280-1240 zone is now labeled as "support":
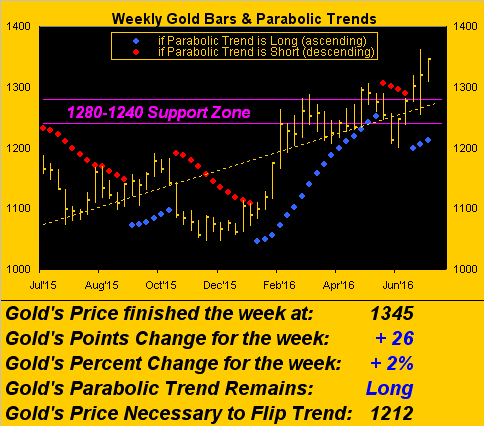
And without further ado, yes, our four technical criteria finally have been met to declare for gold that:
"We now know that the bottom is in!" The bottom to which we refer is last 03 December's low trade at 1046. And if we're correct, on a wing and a prayer and savvy entities moving into gold, we'll see the eclipsing of the All-Time High (1923 on 06 September 2011) -- and indeed the 2000 level -- before returning (if ever) to 1046. Here are the four criteria having driven that decision, and their attendant graphic:
■ The weekly parabolic trend ought be Long ('tis!)
■ Price ought be above the 300-day moving average ('tis!)
■ The 300-day moving average itself ought be rising ('tis!)
■ Price ought trade at least one full week clear above 1280 (just did!)
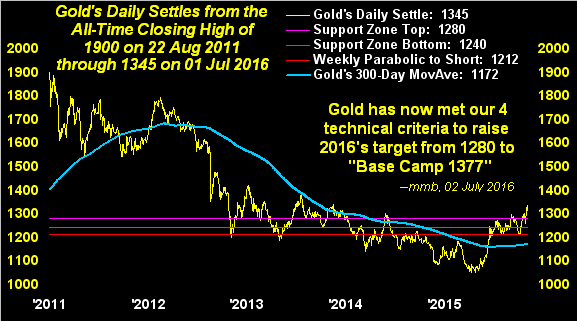
"But mmb, it says in that chart that yer only raising yer target this year to 1377..."
Modest that does seem, Squire. Considering we've still six months (and who knows what unconscionable events) to run in 2016 -- and moreover that the "reaction Brexit Getsit high" already tapped 1362 -- Base Camp 1377 is but a puddle jump away. But from the "Predicting With Prudence Dept.", as pointed out a couple of missives back, were gold to achieve 1377 this year, 'twould be a percentage increase for 2016 of practically 30%. On a year's closing basis, such increase has been exceeded but once in the past 37 years: for 2007 when price settled that year +31.2%. In the "post-Nixon-Gold-nixin' era", only two years have exceeded -- and materially so -- 2007's increase: +36.7% in 1978, en route to the Gold Spike in 1979 of +136.2%. We rather not see the latter occur for something humanitarily horrific having happened. Instead, consider this: were Gold from the start of 2016 to increase at a rate of 15% per year, price would trade up through 2000 in 2020 right about mid-year, just four years from now. We'd happily greet that! 'Course, if we end up getting stuck for months on end back in The Whiny 1290s, which was the centerpiece trading area from June 2013 through September 2014, then methinx I'll take the vows: "There's a convent over that hill" --(Deborah Kerr, 'Casino Royale', 1967) ... or in my case, a monastic winery. Anyway....
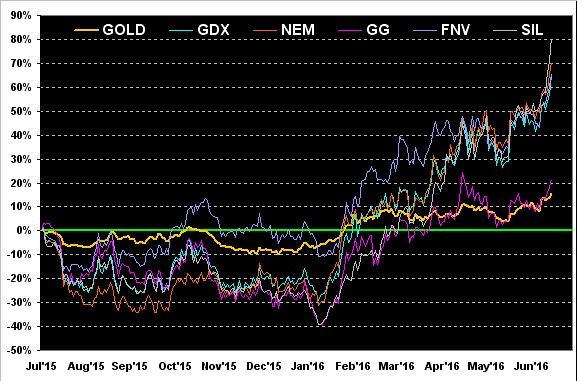
In the interim, we've referred to Sister Silver as screamin': and rightly so. As you saw topping the BEGOS Market Standings at +43.6% year-to-date, silver alone from 01 June through yesterday (01 July) is +24.3%. So as we go to our graphic of gold and its equities brethren, Global X Silver Miners (NYSE:SIL) (the popular exchange-traded fund of the silver miners) is leading the pack, up an electrifying 81% from a year ago; in tow are also NEM (Newmont Mining (NYSE:NEM)) +70%, FNV (Franco-Nevada Corporation (NYSE:FNV)) +66%, GDX (NYSE:GDX) (the prominent exchange-traded fund of the gold miners) +65%, and more modestly GG (Goldcorp Inc (NYSE:GG)) +22% and gold itself +15%. Nice:
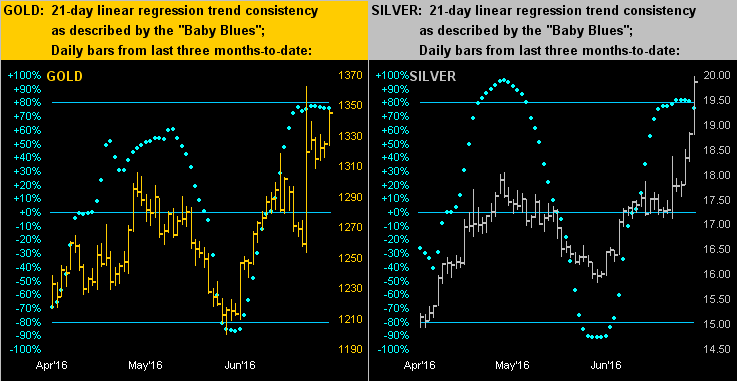
Specific to the metals themselves, here next is the dual-panel graphic showing three months-to-date of daily bars for both gold on the left and silver on the right. The "Baby Blues" are the dots depicting day-to-day 21-day linear regression trend consistency; and at +80%, dat's consistent! One cautionary technical trading note with respect to Sister Silver: if you peek at our Market Magnets page, silver is at an extreme deviation from her Magnet, suggestive of a price "snap-back", which being near the milestone level of 20 wouldn't be untoward:
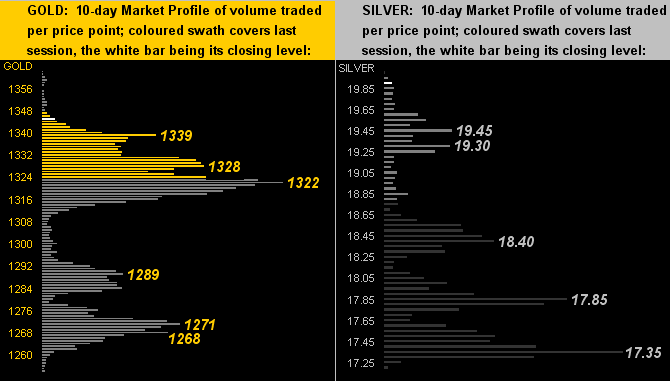
On to the Market Profiles for gold (left) and silver (right). The yellow metal (presently 1345) appears nicely supported down to 1322, whilst same for the white metal (presently 19.86) down to 19.30. That said, their "expected daily trading ranges" (EDTRs) per the website's Market Ranges page are respectively 26 points (gold) and 0.54 points (silver); thus said support areas could get tested in a heartbeat:
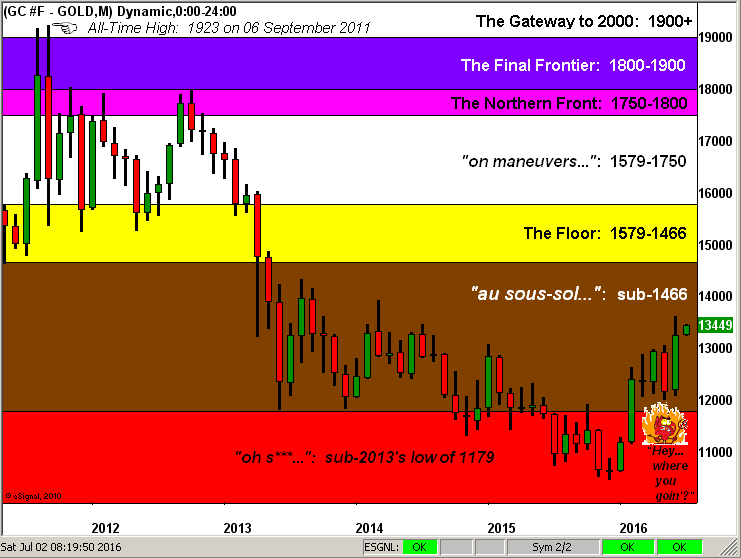
Finally, with another trading month in the books, 'tis time to bring up our Gold Structure graphic with its broad-based defined strata. As we've one trading day already completed in July, that alone is the rightmost green stub. But stubby or otherwise, our little friend near the base of the chart has changed his demeanor such as to not look very happy about it all; ('course, it being an election year here, folks do worry about losing control ... am I allowed to write that, Mr. Editor?). Nothing like making headway back up into the basement, (sous-sol) eh?
In closing, we've these few salient thoughts:
■ From our good colleagues on the opposite side of the globe at New Delhi's Sakshi Post -- in citing the opinion of "commodity experts" -- 10 grams of gold (that' just over one-third of an ounce) ought reach a price of 33,500 Rupees come this December! Why the emphasis? That works out to one ounce of gold at some 95,000 Rupees. Figuring 66 Rupees for one Buck: 95,000 ÷ 66 = $1,439/oz. What was that hit by The Miracles (appropriately) back in '66? "Going to a Goa...".
■ Again with reference to the standings of the BEGOS Markets shown at the outset, you'll have noted the Bond (30-yr. Treasury futures price) is +14.4% thus far this year, driven higher by the underlying product's yield having dropped from closing out 2015 at 3.015% to now 2.241%. The 10-yr. variety at 1.456% is now a four-year low. Surely our Federal Open Market Committee shall, in turn, lie low, perhaps even rescind to increase the spend? But wait, there's more: per the FinTimes this past week, global sovereign debt now totals a record $11.7 trillion on which yield is negative! Say goodnight, Janet.
■ Speaking of the Fed, you may have read that some 71% of StateSiders think that our economy is "rigged" toward "certain groups". Obviously we take that seriously as also we take to heart the reported metrics that build our Economic Barometer. One has to wonder if "certain groups" include the Bureau of Labor Statistics, which again speaking of miracles, typically comes up with 100,000s of net new payrolls per month, whilst concurrently folks are leaving the labour force at an arguably faster pace. Welcome to the world of one less one equals one? So for all you film producers out there, you've likely a blockbuster in something such as "The Day It All Went Wrong". 'Twould be the perfect film for Cannes' Palme d'Or (Gold Palm award). Call me, sweetheart, to stop by the yacht and we'll make a deal.
■ Lastly, in the reeling wake of the Brexit vote, Fitch having downgraded the UK's "Long-Term Foreign and Local Currency Issuer Default Ratings" from AA+ to AA, whilst flicking their outlook toggle switch to Negative, and Moody's having downgraded the UK's banking sector, (save for RBS (LON:RBS), which being in Scotland merited a reaffirmation of "positive"), there is a notion running about that the US ought adopt the UK as a 51st State. But should it not be 180° right 'round, that the US replace the UK in the EU? Why, given the trend of our economics and political tilt these last few decades, we'd fit right in!
The ensuing week's incoming EconData culminates with June payroll creation on Friday (08 July). After weak creation of just 38,000 payrolls in May, consensus for June is 175,000. But if 'tis truly rigged ... Base Camp 1377 for gold?