We start by dusting off our dog-eared Funkin' Wagnalls dictionary:
■ mo·not·o·ny noun:
lack of variety and interest; tedious repetition and routine.
"Gold's state of being forever stuck in the $1,200s is one of monotony."
■ des·ti·ny noun:
an event that will necessarily happen to a particular thing in the future.
"Gold's date of being priced beyond $2,000 is one of destiny."
■ when adverb:
at what time.
"Better to be in before the when than wait 'til then."
"But time is money, mmb..."
So is Gold, Squire, as well as its being a store of value, (unlike popular equities past such as Bear Stearns which slid from $159 to $2, or Enron, its skid from $90 to 60¢, or even contemporarily the 35 companies in the S&P 500 that have negative "earnings").
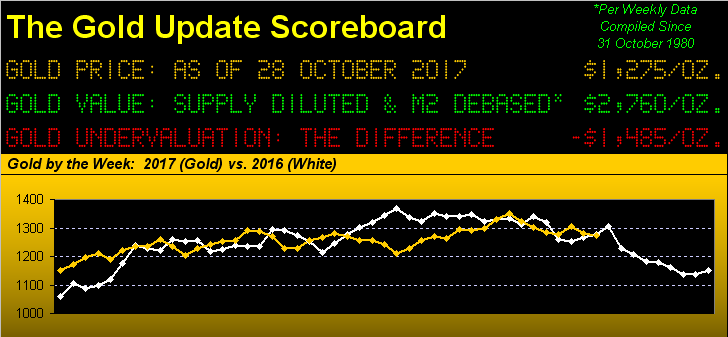
Still, per our opening Gold Scoreboard, price remains well behind the currency debasement curve, by which (with a tip of the cap to the World Gold Council for confirming to us their updated Gold tonnage figure) we calculate ought have price today at 2760, rather than at 1275 per yesterday's (Friday's) settle.
Monotony indeed, considering that a year ago today Gold was but a buck higher at 1276. Yet since then, the S&P 500 is up 21% from 2133 to 2581. And you can forget the old saw that Gold and the S&P cannot significantly rise together: year-over-year from 23 July 2010 through 22 July 2011, the S&P rose 22.0% (from 1103 to 1345) whilst Gold simultaneously rose 35.4% (from 1189 to 1600), at which time you'll recall our writing about Gold's "getting ahead of itself". 'Course today, from "The Dept. of Duh!", 'tis horribly behind itself.
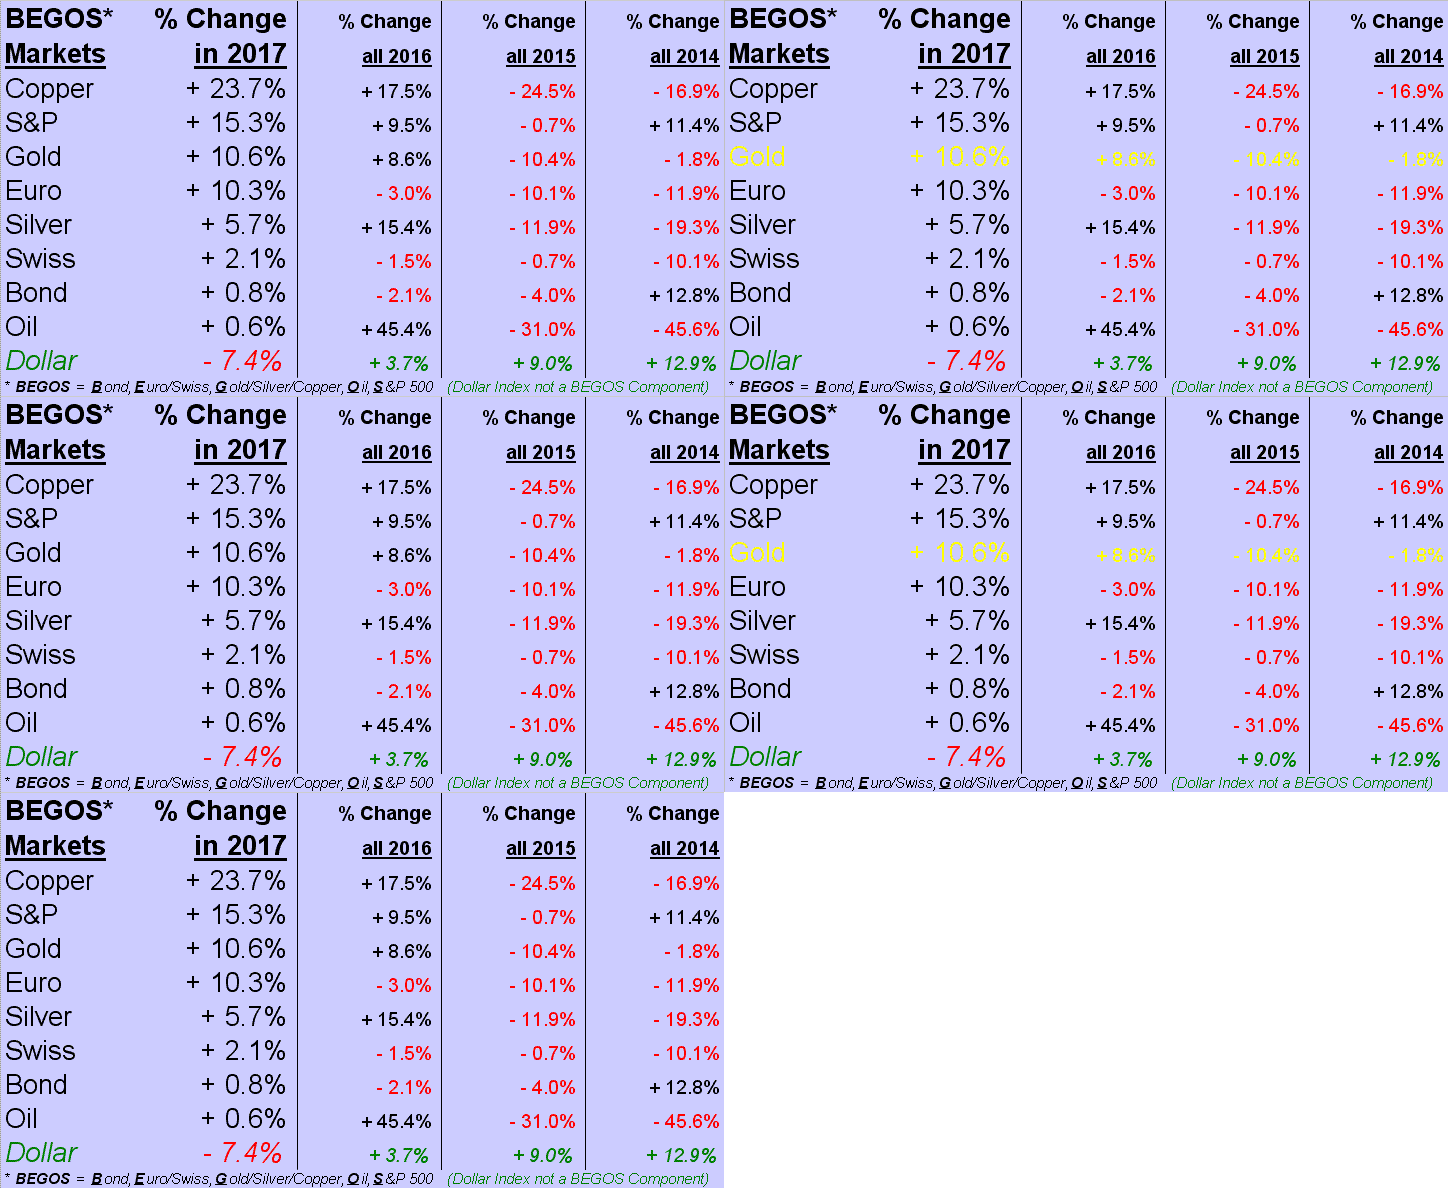
Now we're not quite at month-end, but let's so treat it, given Monday and Tuesday (30 and 31 October) are but two trading days ahead of the Federal Open Market Committee's policy statement on Wednesday (01 November); typically in anticipation of that, there's not much early week market movement. So here we go with our 10-month (less two trading days) year-to-date standings of the BEGOS Markets, wherein we see "Cousin Coppa partyin' like there's no tommorra", whilst the declining Dollar Index is en route to its worst annual loss in 10 years (-8.1% back in 2007 ... a year in which Gold rose 31.3%):
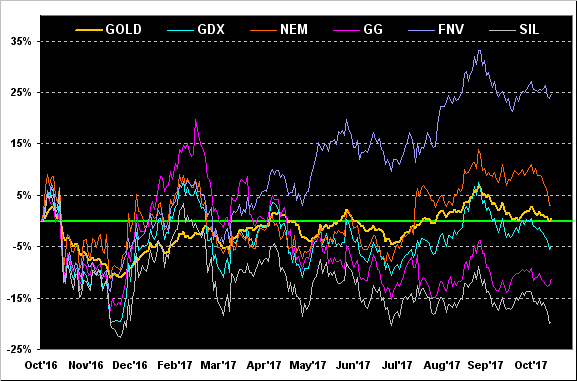
Specific to Gold and its equity mates from a year ago-to-date, the picture doesn't look so great. Save for Franco-Nevada (NYSE:FNV) +25%, we find Newmont Mining (NYSE:NEM) +3%, Gold itself as noted "unch", the VanEck Vectors Gold Miners exchange-traded fund (NYSE:GDX) -5%, Goldcorp (NYSE:GG) -11%, and the Global X Silver Miners exchange-traded fund (NYSE:SIL) -20%. Here are their not-so-crack percentage tracks:
And as a great and good friend of The Gold Update frequently reminds us, the present Gold/Silver ratio is 75.6x versus the average millennium-to-date ratio of 62.7x. Simply to return to that mean requires Silver rising from its present 16.87 level to 20.33, or Gold declining from the present 1275 to 1058 ... or something by both in between. But our lean is for Silver to rise rather than Gold decline, as by the Copper/Silver ratio, (presently .184 vs. average .173), we ought find Silver at nearly 18. Time Sister Silver gets a little industrial metal polish to enhance her precious metal luster.
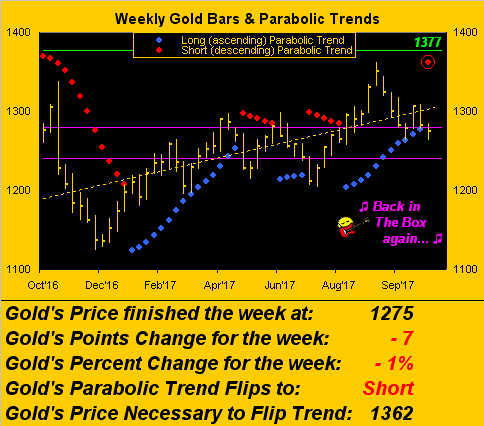
But lackluster as we'd anticipated is now the state of Gold's weekly bars, their parabolic trend having flipped to Short. 'Twas a fun Long trend run up to the year's high of 1362, falling just shy of last year's high at Base Camp 1377, only to now be back down here at 1275, a level first achieved over seven years ago on 14 September 2010. The StateSide money supply (M2) alone on that day was $8.67 trillion ... today 'tis 59% higher at $13.74 trillion, (hint hint, nudge nudge, elbow elbow). Here's the weekly bars chart from a year ago-to-date, replete with the ever present purple-bounded centerpiece of The Box (1280-1240), (which we hope doesn't get bust), along with the first fresh red dot of parabolic Short trend:
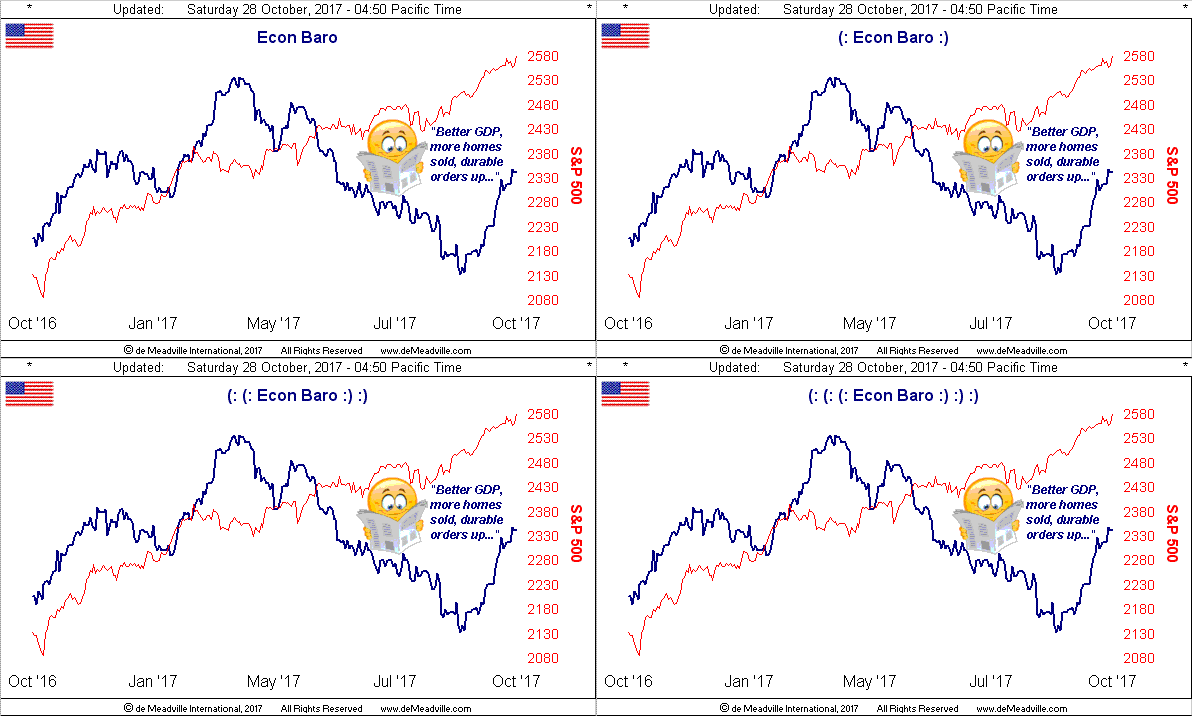
'Course of late, from bust to boom has gone the Baro, which in a sense may belie the new release of U.S. annualized 3% growth in gross domestic product as some two months of the data making up the third quarter was recorded during the blue line's decline. Still, the Baro's burgeoning up through October (on September data) helped the GDP spree in Q3 ... from which in turn we'll likely see a rate hike from the FOMC:
As for the precious metals, good timing is not all that it could be. So in turning to the daily bars over the past three months for both Gold on the left and Silver on the right, in both cases we see the baby blue dots of 21-day linear regression trend consistency running out of puff rather than completing the trip up to the +80% level, the latter run having generally been their wont throughout the year:
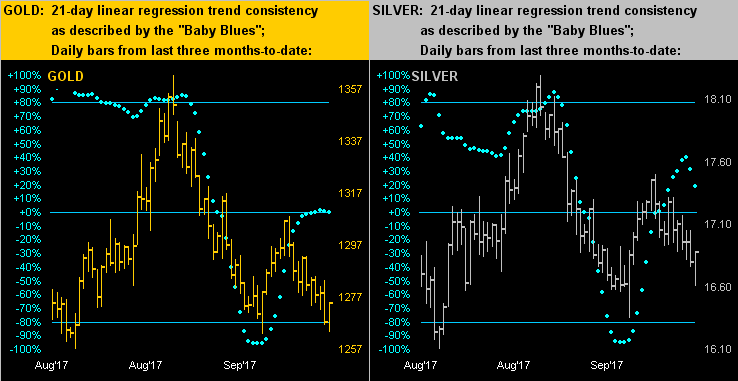
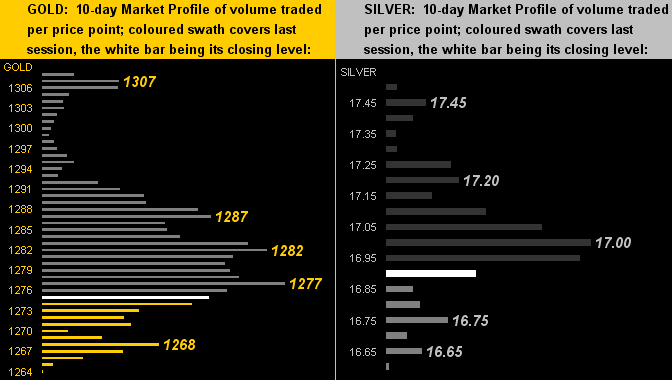
Still, the rightmost bar in both of the above panels shows price resilience as buyers came in post-GDP report on Friday to push levels to session highs right up into the close. That is below reflected as well in the 10-day Market Profiles for Gold (left) and Silver (right). And for the bazillionth time, 'tis all about Gold getting at least back above the top of The Box (1280) and for Silver to reclaim at least 17.00:
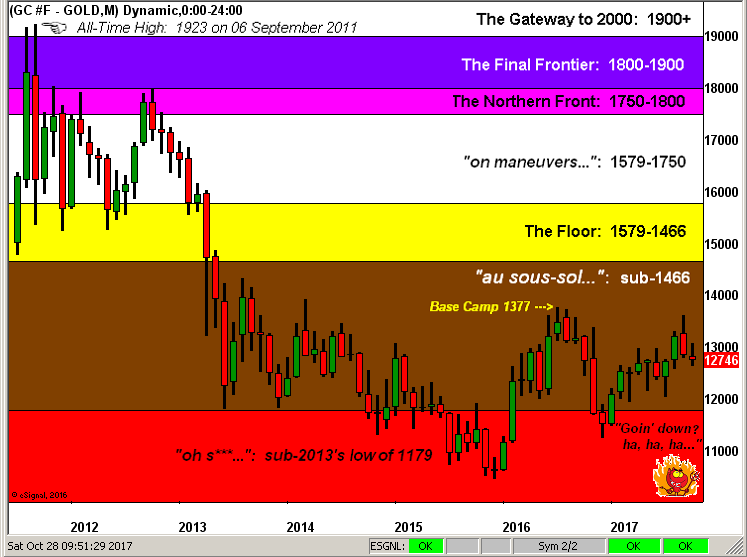
Finally in concert with month-end we go to Gold's structure, it's defined upper strata still lying in wait for price's inevitable return, despite the heated machinations of the wee fellow down below:
In closing, as noted, the FOMC folks are gathering this Halloween (Tuesday) toward providing us with their next policy statement on All Hallows' Day (Wednesday). So what'll it be, FOMC? Trick, or Treat?
Just because there is no scheduled press conference from Chair Yellen doesn't mean they can't make a rate hike now rather than wait for the expected move in December. However, given the Fed's tendency to be "behind the curve" we doubt they'll try any trickery this time 'round. But ya never know... In any event, think destiny and hang onto your Gold!