Gold looks technically superb, and the fundamentals look even better.
Inflation is rising in China and the West, the dollar looks shaky against key fiat competitors, and a reversal in American money velocity is imminent.
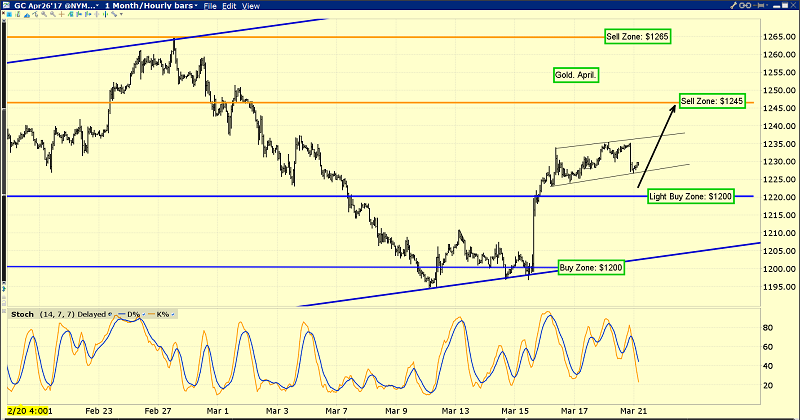
This is the hourly bars gold chart.
The next COMEX options expiry day is March 28. Gold has a rough general tendency to trade a bit sluggishly ahead of option expiry days, and that appears to be happening now.
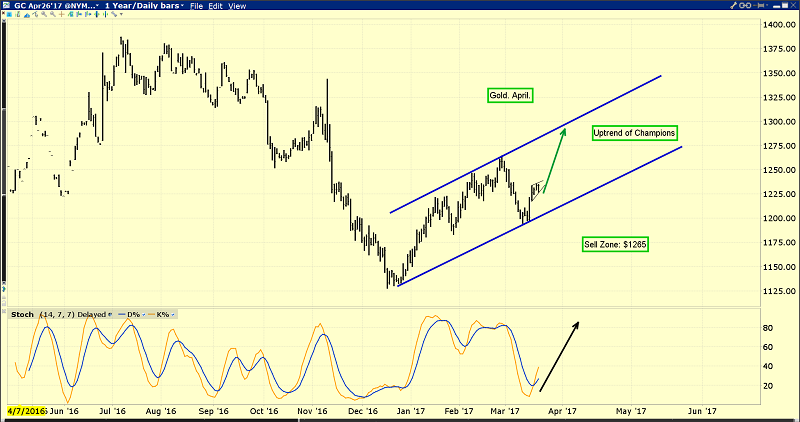
This is the daily bars chart for gold.
I call this technical picture the “uptrend of champions”.
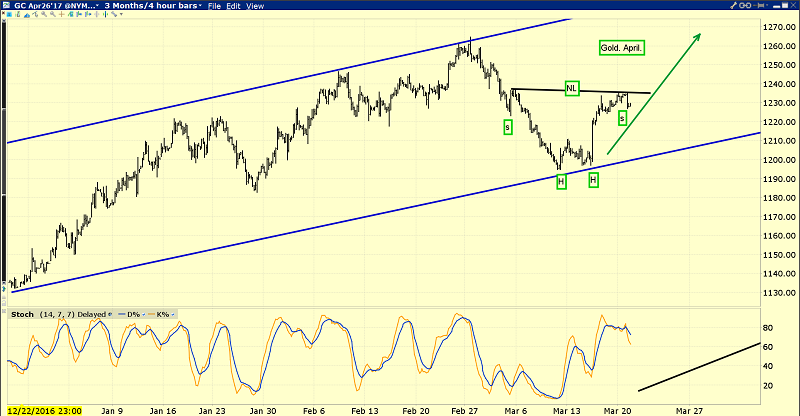
A closer look at the price action within the uptrend channel. There’s an inverse H&S bottom pattern in play on this four-hour bars chart.
For gold, all my technical lights are green, and once this option expiry day is out of the way, the “Queen of Assets” should make a beeline towards the $1265 area highs!
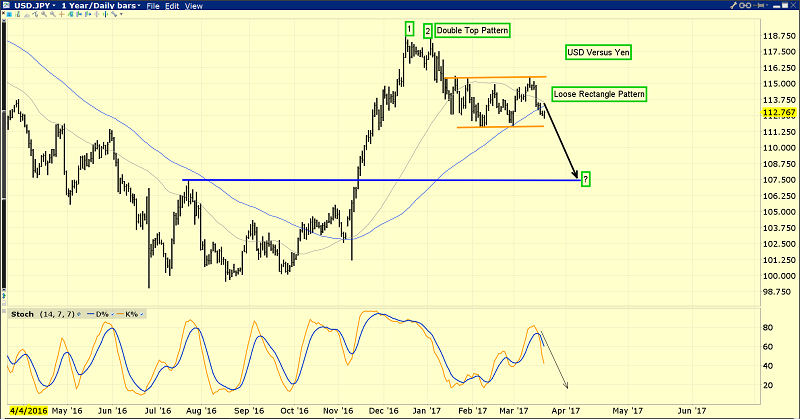
Against the yen, the dollar looks horrible. Note the action of the 50DMA and 100DMA moving averages. A sell signal seems imminent. That’s good news for higher gold price enthusiasts.
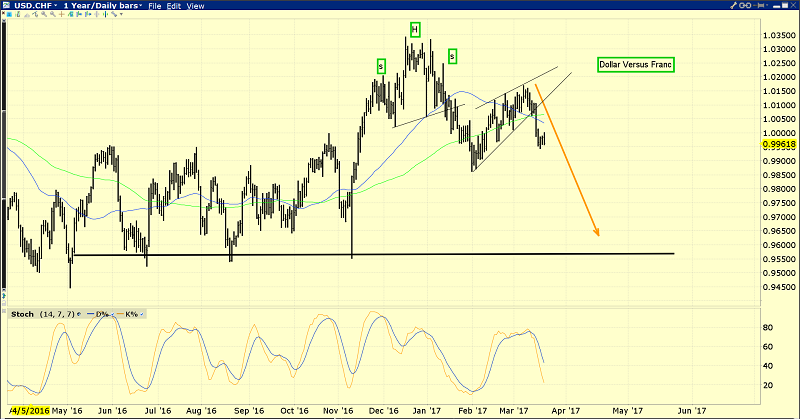
Against the Swiss franc, the dollar looks like a train wreck. The moving averages are flashing a sell signal, and that comes after a meltdown from an H&S top pattern.
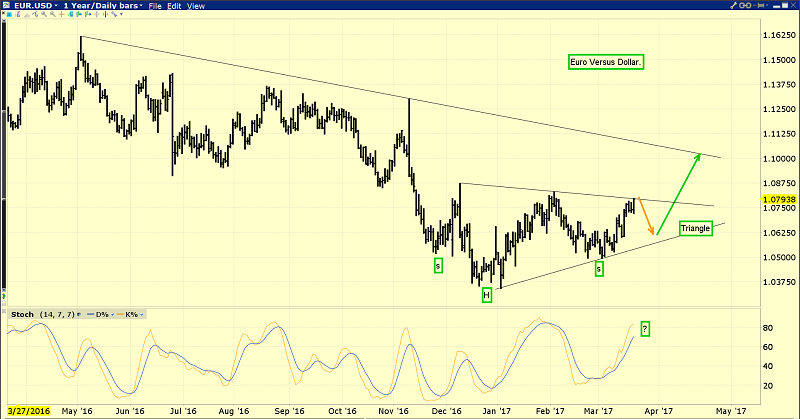
The euro is rallying strongly against the dollar, and it looks set to stage an upside
breakout from both a triangle and inverse H&S bottom pattern.
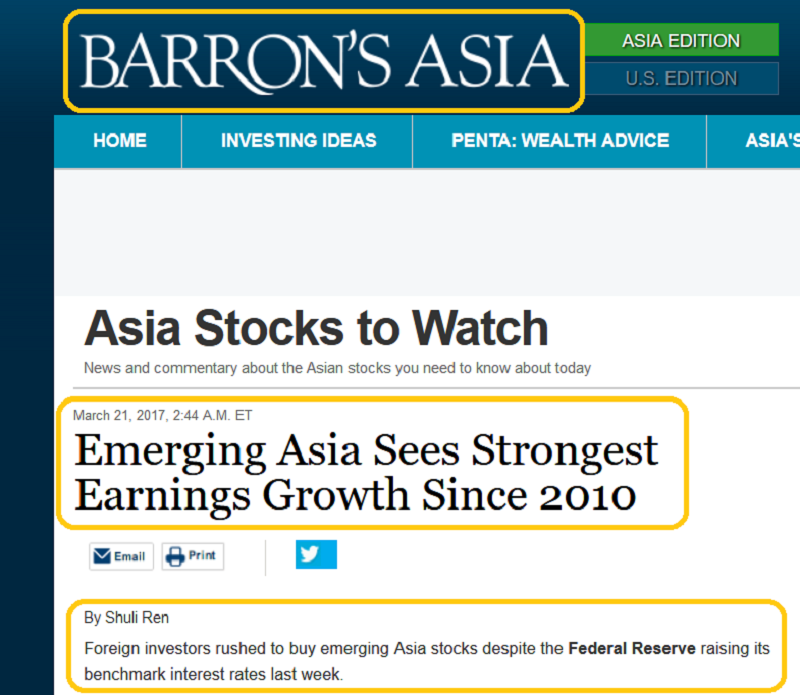
It’s clear that for their stock market action, the Western gold community should be selling America at a profit and buying Asia.
American bank stocks are the one exceptions to that “rule”; banks will prosper as rates rise. They will do a lot of lending to Europe and to Asia, because that’s where the higher growth is going to take place.
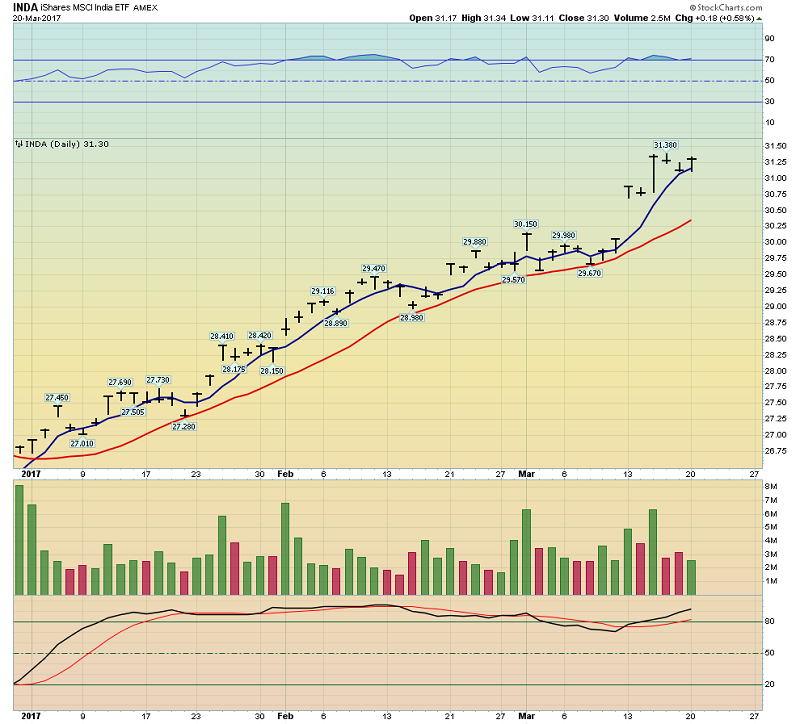
That’s the iShares MSCI India (NYSE:INDA) stock market ETF, and the price action is superb.
From an emotional perspective, Western gold bugs (including myself) tend to get very nervous about US stock market sell-offs. We tend to wonder… “Is this the big one?”
Having a tremendous floor of positive fundamentals can help to alleviate those concerns. Those fundamentals exist in China and even more so in India.
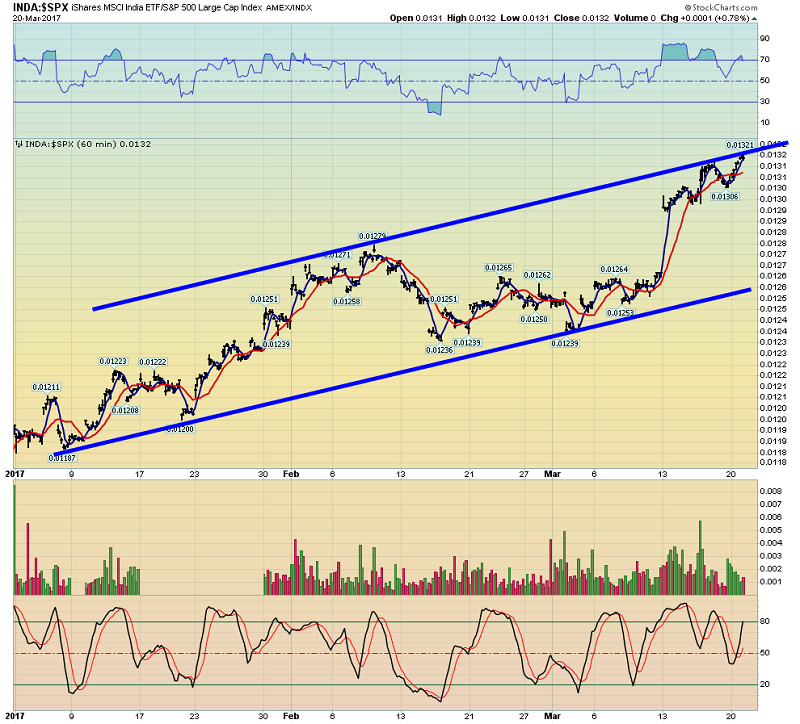
That’s another look at the Indian stock market ETF, this time against the American S&P 500 index.
I expect this massive outperformance of India versus America to continue not just for months or years, but for decades, and perhaps for the next 100 - 200 years.
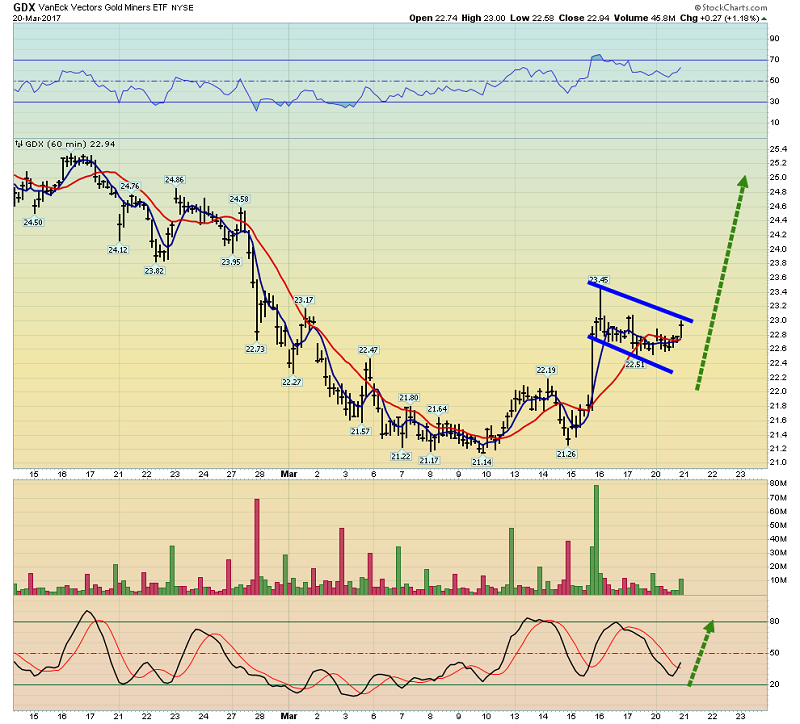
This is the fabulous short-term GDX chart.
It’s very important that all gold stock investors do not get overly carried away with price action that is mildly disappointing.
The bottom line is that gold stocks soared on Janet’s third rate hike, and are now treading water ahead of options expiry day for gold.
There’s a flag-like pattern in play for GDX and many key senior gold stocks. The volume pattern is excellent; volume is rising on upside price action, and declining on downside price action.
If most gold stock investors are honest with themselves, I don’t think they expected to see QE tapered to zero, rate hikes in play, with gold and gold stocks doing well!
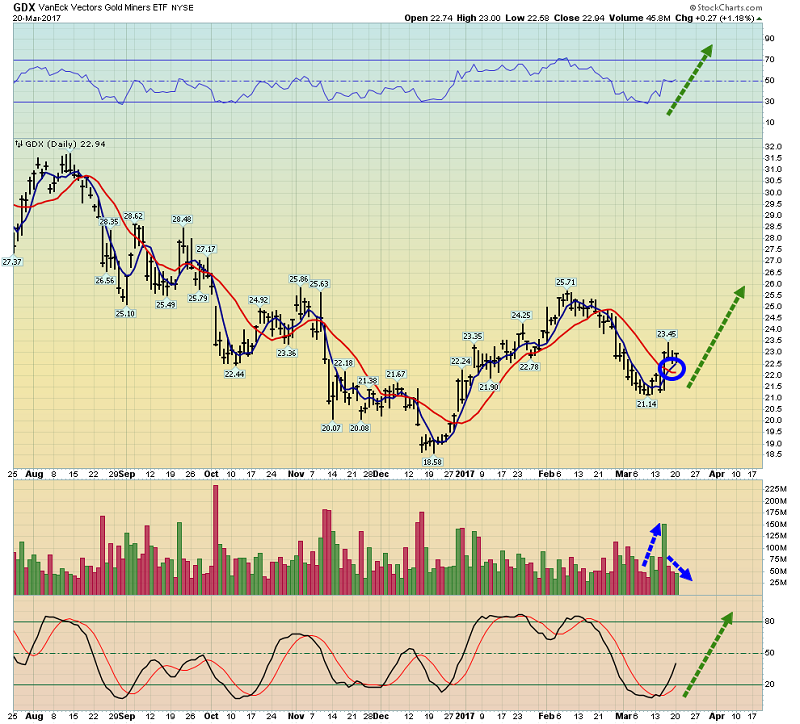
On this daily bars chart, GDX looks great. There’s now a buy signal in play on the 5,15 series of moving averages, volume is superb, and my 14,7,7 Stochastics oscillator is roaring higher. All lights are green for the world’s ultimate asset, and for the great mining companies that dig it out of the ground!
Stewart Thomson is no longer an investment advisor. The information provided by Stewart and Graceland Updates is for general information purposes only. Before taking any action on any investment, it is imperative that you consult with multiple properly licensed, experienced and qualified investment advisors and get numerous opinions before taking any action. Your minimum risk on any investment in the world is: 100% loss of all your money. You may be taking or preparing to take leveraged positions in investments and not know it, exposing yourself to unlimited risks. This is highly concerning if you are an investor in any derivatives products. There is an approx $700 trillion OTC Derivatives Iceberg with a tiny portion written off officially. The bottom line:
Are You Prepared?
