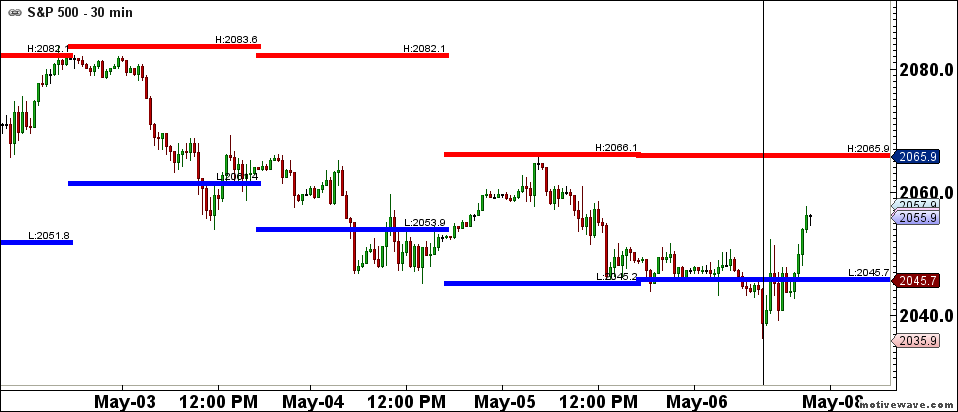
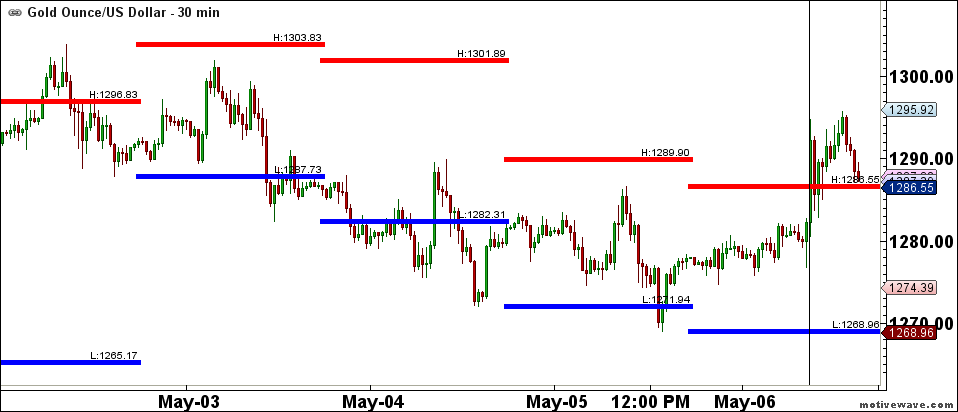
It has been a volatile five days of trading in the financial markets while awaiting Friday's Non-Farm Payrolls (NFPs), as the S&P 500 rallied to 2,083.6 to start off the week, traded to a low of 2036.2 right after NFP today, but closed sharply off the lows at 2055.6. The choppiness in oil continued as prices mainly traded within a $3 range from the highs of $46.14 to a low of $43.22, and closing at $44.53. The EUR/USD ended six-days of strength by trading lower in the last four days from a high of 1.1617 to finish at 1.1410. Finally, U.S. 10-Year Treasury Yields initially dropped fifteen basis points from the highs of 1.87% to a low of 1.72% right after NFP to close the week at 1.77%, and Gold initially traded lower for the week, from a high of 1303.83 to a low of 1268.96 on Thursday, closing the week with a sharp bounce at 1288.86.
US Economic Data
It was a big week for the market as investors continued to evaluate economic data to gauge the overall health of the economy. The largest market mover came from NFP which showed that only 160,000 jobs were created in the US economy. While this number was lower than the expected 203,000, average hourly earnings climbed 0.3% higher from March giving the Fed some much needed validation for wage increases. The ISM manufacturing index in April showed that the US slowed down marginally by dropping a point to 50.8. Although the reading came below expectations, it is still above the significant 50 point threshold indicating continuing of expansion. Although a weaker US dollar and rising oil prices have added strength in manufacturing activity, it is unlikely to receive more support from these same factors. Auto sales for the month of April bounced back strongly which suggests that consumer spending will likely get a lift for Q2. On top of that, the US international trade deficit declined more than expected to $40.4 billion with imports falling more than exports largely due to the recent dollar weakness. Getting back to NFP and Average Hourly Earnings, some analysts are saying that the rise in wages, if it triggers inflation, could influence the Fed to raise rates in June. However, post NFP, the markets are saying differently about June rate hikes.
Market Correlations
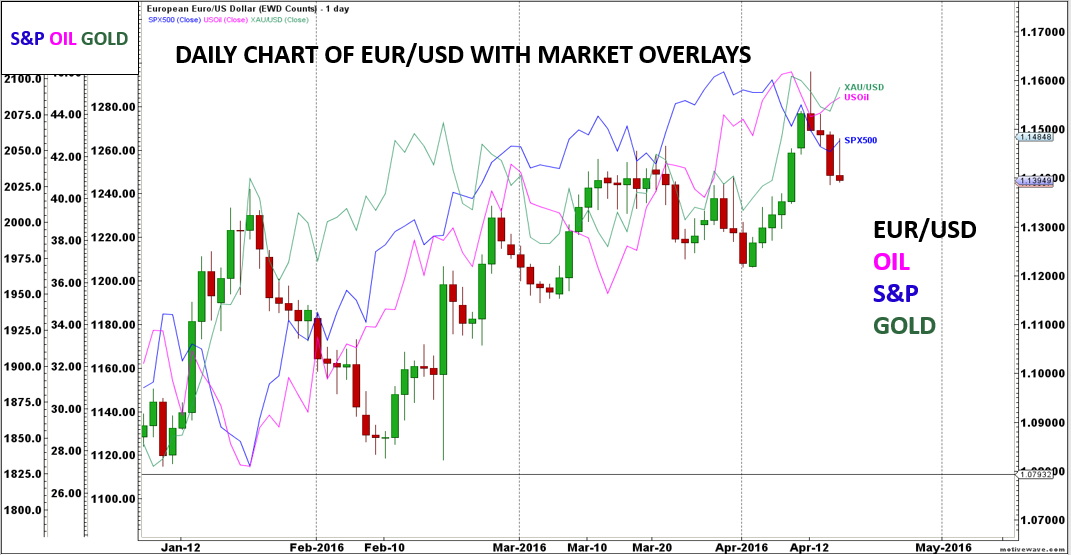
The chart below shows how well the EUR/USD, oil, S&P 500 and gold have correlated since January 2016. Intermarket analysis is key to understanding what is driving markets and at any point in time, there are different drivers. Currently, the key drivers are US economic activity and when the Fed will continue to raise rates.
EUR/USD
Meanwhile in Europe, the manufacturing sector for April improved slightly to 51.7 points from March’s reading of 51.6. Moreover, retail sales in the Eurozone fell in March after five consecutive months of gains which may be a sign that the Euro area is still susceptible to hindrances despite the monetary easing implemented from the ECB. While players tried to extend the rally in the EUR/USD earlier in the week, price failed to sustain gains above 1.1600 and closed well below at 1.1410. The weaker NFP initially drove the EUR/USD higher to 1.1480, and quickly reversed its gains. Next week we should continue to see the EUR/USD trade lower provided we respect 1.1480 and then 1.1617.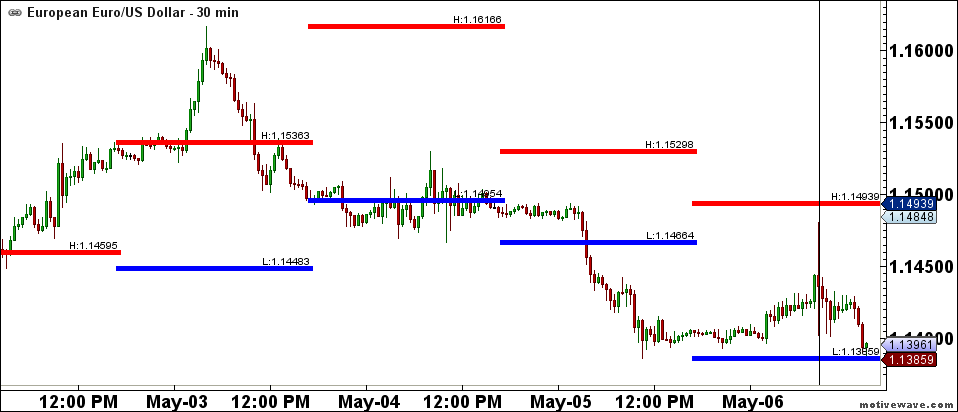
OIL
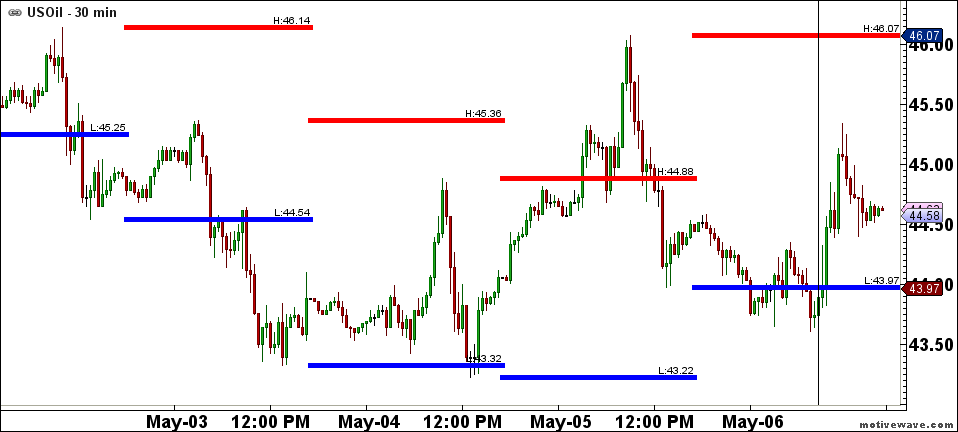
Oil prices declined initially to start the week as OPEC oil production almost reached its highest level in history, ultimately offsetting the decrease in US output. Nonetheless, oil staged an impressive mid-week comeback despite the US EIA announcing that crude oil inventory grew by 2.8 million barrels this past week, which was twice as much as what the consensus had expected. Moreover, crude prices spiked higher on Thursday after a large wildfire in Canada drove fear of a short-term supply shortage. Post NFP, oil initially tested lower but quickly reversed its losses, similar to the EUR/USD reversing its gains. Next week expect oil to remain range-bound unless the market breaches 46.14 or 43.22.
GOLD
Gold took a breather after spiking almost $65/ounce the prior week as the Atlanta Fed President Dennis Lockhart stated that June is in the cards for a potential rate hike. Similarly, San Francisco Fed President noted that he will support an increase in interest rates contingent on persistent improvement in the economy, inflation, and the labour market. Despite the slightly hawkish tone of the Fed Presidents, anxieties over a global economic slowdown and lowered expectations of the Fed raising rates continues to give more incentive for investors to lean towards gold as a safe haven asset. On an Elliott Wave context, we are bullish Gold but would like the highs of 1303.83 to be taken out for further gains.
S&P 500
Finally, the S&P 500 sold off during the week and staged a nice recovery after NFP. From an Elliott Wave perspective, the S&P 500 has retraced a shallow 23.6% of the prior swing move higher, so keep a watch out for the 38.2% level of 1995.7 should the lows of 2036.2 be taken out.
