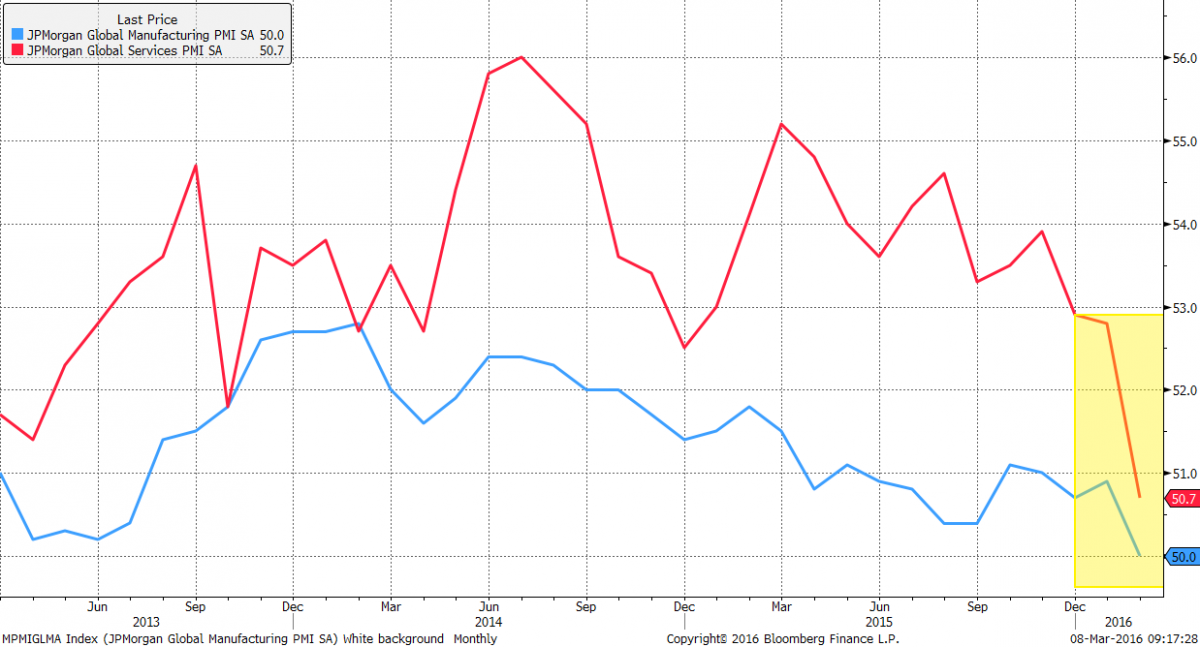
Forward-looking indicators for the global economy fell sharply for the month of February. The JPMorgan Global Manufacturing PMI (in blue) is now resting at 50, which is the key threshold separating expansion from contraction.
At the end of last year, the services measure (in red), which increasingly comprises a larger share of global GDP, was sitting comfortably above contractionary territory near 53 and was as high as 55 toward the first half of last year. It has now fallen steeply to 50.7 and shows the global economy is on a much weaker footing compared to last year (all charts below courtesy of Bloomberg).
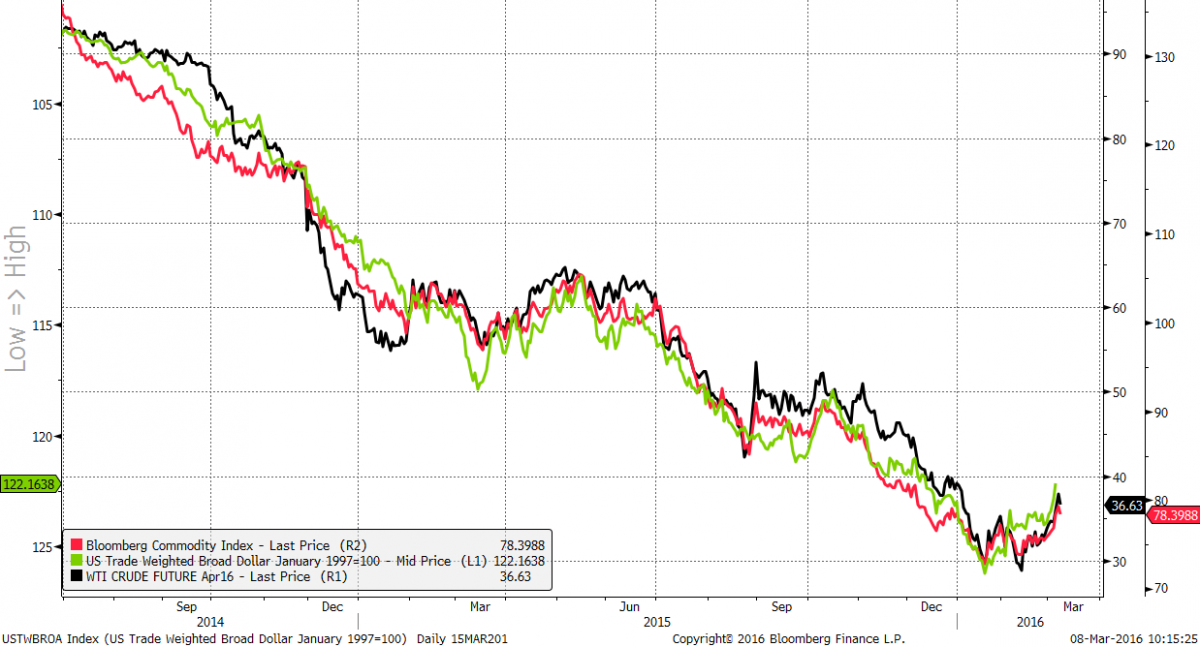
In the next chart we take a look at the recent bounce in commodities (via the Bloomberg Commodity Index) and oil. As you can see, it's all about the dollar. Here we've plotted the trade-weighted broad dollar index (inverted, in green) next to oil (in black) and commodities (in red). The correlation between the three is quite striking. If you are betting on oil and commodities to move higher, then you are betting on the dollar to weaken from here.
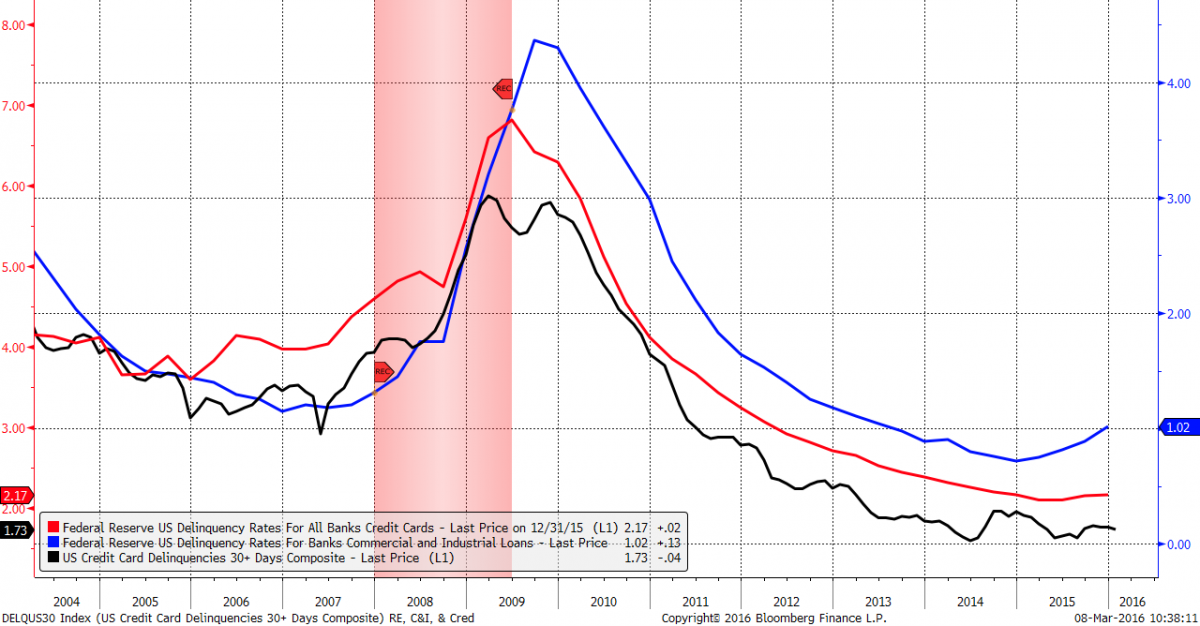
Do credit card delinquency rates help predict the onset of recession? See for yourself. Here are three measures we are watching that have a fairly high correlation over time, which also help to signal economic downturns. Credit card delinquency rates appear to be forming a bottom similar to 2005-2006, but the most troubling are delinquency rates on commercial and industrial loans (in blue), which are now clearly trending higher. In terms of the last economic cycle, this appears more similar to where we were in 2007.
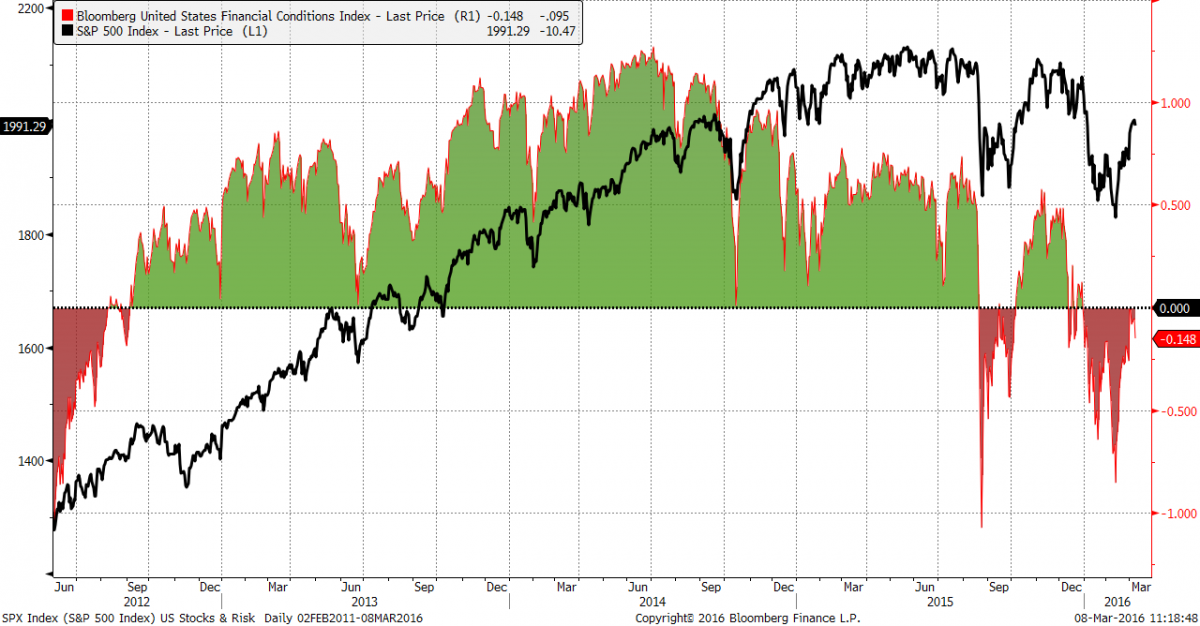
Financial conditions in the US turned decidedly positive in the third quarter of 2012 and remained so until turning decidedly negative in the third quarter of 2015. The recent market rally off the February lows was unable to lift financial conditions back into favorable territory.
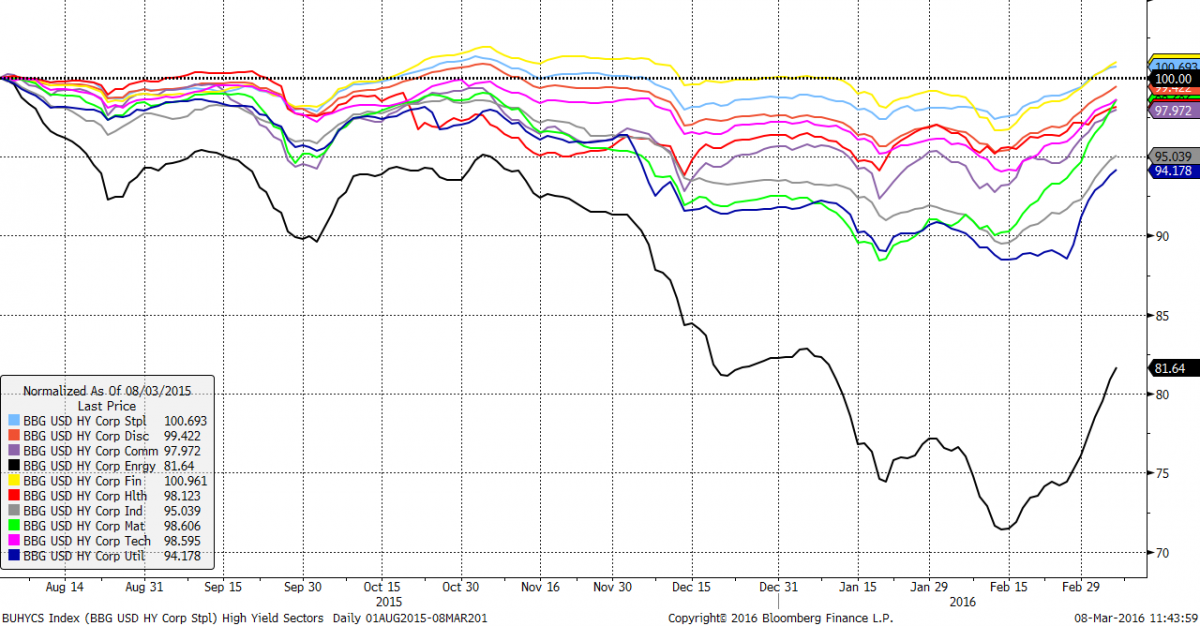
An area that strategists are closely watching for signs of improving or worsening financial conditions is the high yield market. High yield corporate bonds for each of the 10 major sectors have traded flat to negative since last year, with energy seeing the greatest damage. All 10 sectors of the high yield market are now rallying from their lows. Can this be sustained? Time will tell.
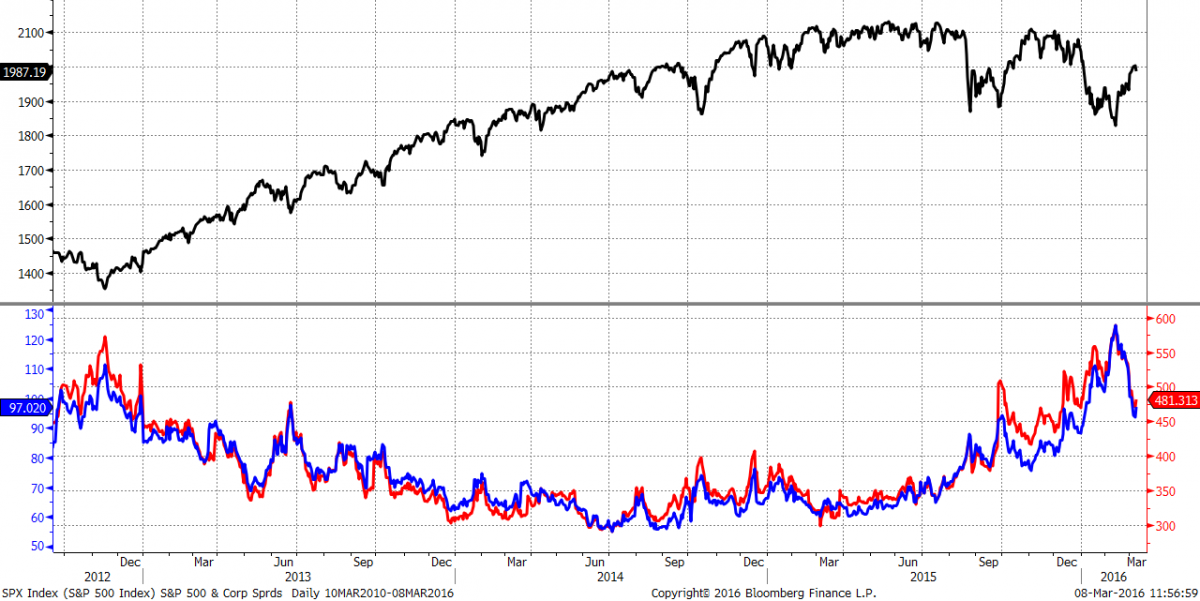
Here's another look at corporate spreads, both high yield and investment grade, compared to the S&P 500. Credit spreads were narrowing from 2012 until around 2014-2015 when they started to widen and signal greater pressure on the market. Echoing the chart above, they've since backed off their highs though it's unclear whether this is a change in trend or simply a pause before heading higher.
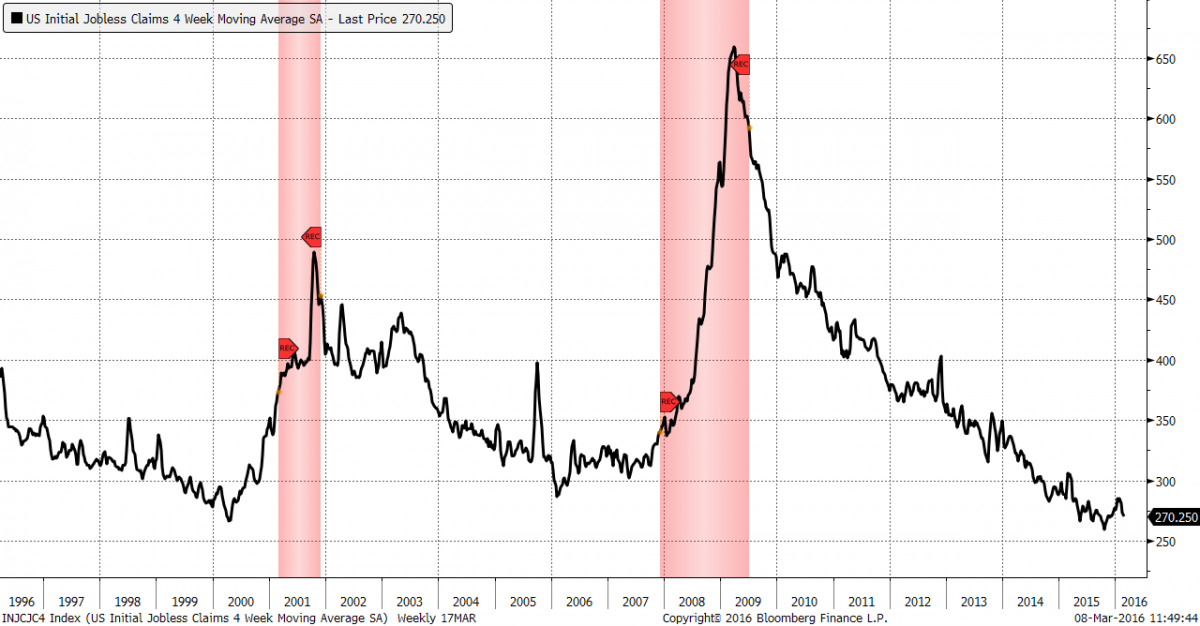
On a more positive note, initial jobless claims are not yet raising a recessionary red flag for the US. This agrees with the overall message coming from broad US leading economic indicators like the Conference Board's LEI (see here). We continue to watch the LEIs closely for signs of further deterioration or, conversely, a turnaround, however unlikely that may seem.

