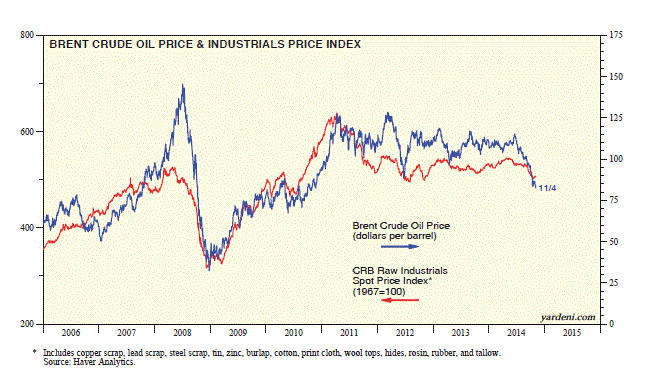
The ongoing decline in oil prices since the summer reflects a glut of supply rather than a sudden slowing in the global economy, in our opinion. I note that the CRB raw industrials spot price index remains range-bound since 2012, though it is near the bottom of that range. If it dives below it, I will have to reconsider my assessment of the global economy. Here’s a brief rundown on some other recent economic indicators:
(1) Europe. Manufacturing activity in the UK improved in October, while it remained subdued in the Eurozone. The UK’s M-PMI increased for the first time in four months from a 17-month low of 51.5 in September to a three-month high of 53.2 last month, boosted by domestic demand. The Eurozone’s M-PMI ticked up from a 14-month low of 50.3 to 50.6, the third reading just above 50.
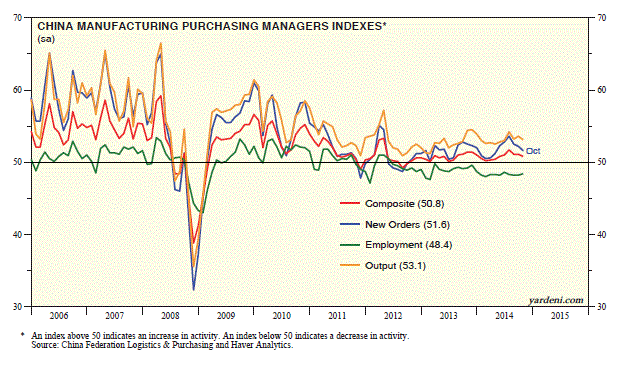
(2) China. China’s official M-PMI fell from 51.1 to a five-month low of 50.8 last month. Growth slowed for production (from 53.6 to 53.1) and new orders (52.2 to 51.6), while new export orders (50.2 to 49.9) contracted for the first time in May, albeit slightly. The supplier deliveries measure was unchanged at 50.1. The employment measure ticked up from 48.2 to 48.4, its 29th consecutive reading below 50.
Today's Morning Briefing: As The World Turns. (1) Wild ride in S&P 500 Transportation. (2) Burning cheaper fuel. (3) Intermodal loadings at record high along with ATA Trucking Index and real business inventories. (4) Slow speed reduces odds of derailment. (5) A couple of hot capital spending indicators in GDP. (6) Gasoline bill cut by at least $100 billion. (7) Wage gains remain too low for Yellen. (8) M-PMIs show global economy muddling along. (9) Focus on overweight-rated S&P 500 Transportation.

