The following year-to-date graphs of the U.S. Major Indices and Major Sectors show that market participants have favored riskier technology, small-cap, and consumer cyclical stocks.


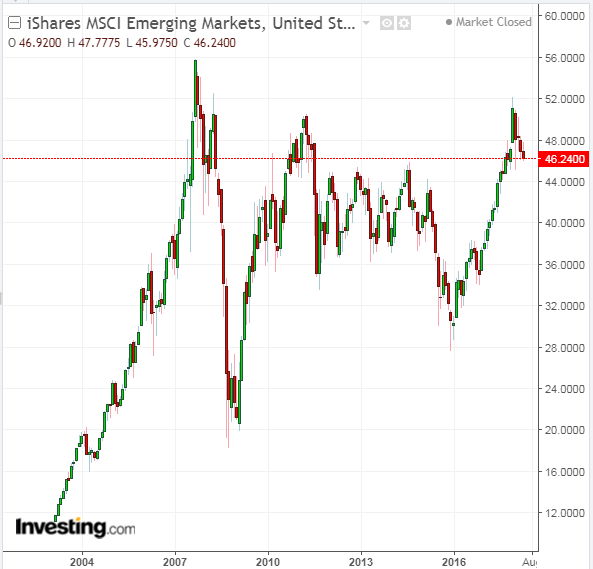
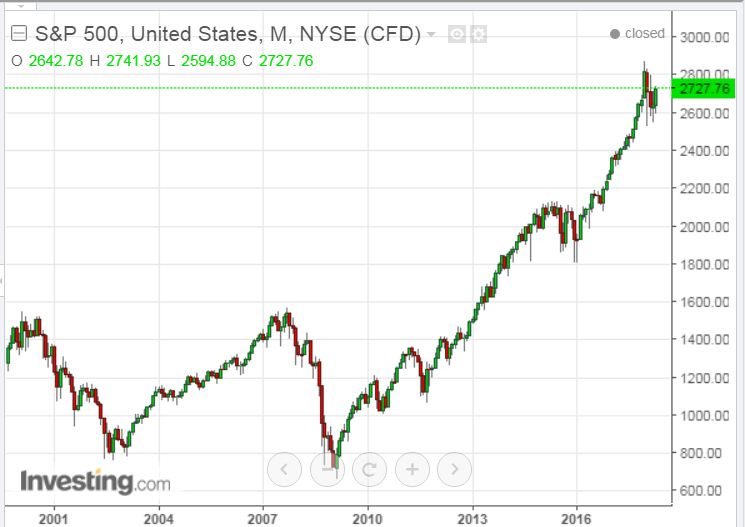
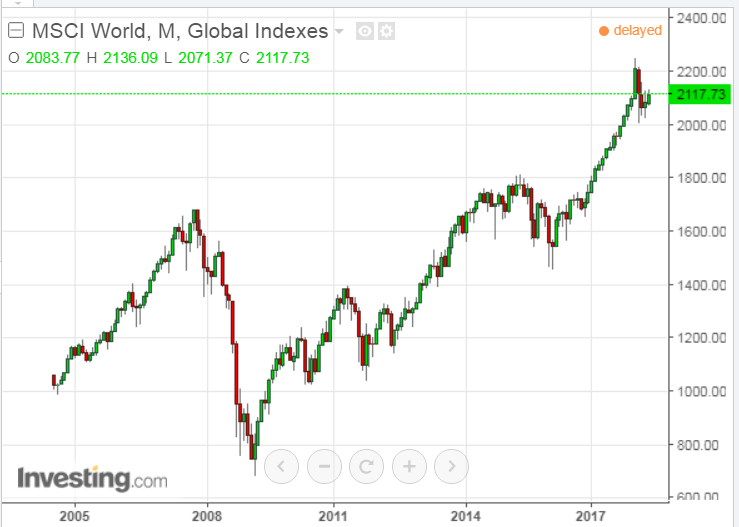
As you can see from the following monthly charts of the S&P 500 Index, MSCI World Index, and iShares MSCI Emerging Markets (NYSE:EEM), money has been flowing in and out of them on increased volatility all year since they peaked at or near their all-time highs in January...pretty much as I speculated in my Market Forecast for 2018 post at the end of last year.
With rising tensions related to the upcoming U.S. November mid-term Congressional election and other domestic political pressures, world politics and markets, North Korea, Iran, China, trade imbalances, emerging market challenges, increasing inflation and interest rates, and Central Bank money tightening measures in various countries, it's difficult to see where these markets will gain and hold traction to increase much beyond their highs of this year, on a broad scale.
As such, we may see this kind of money 'ebb and flow' scenario continue throughout the remainder of the year, with markets either stuck in their current trading ranges while rotating in and out of various sectors, or maybe drift higher in a slow, choppy and volatile manner, until some kind of major catalyst propels the markets decisively one way or the other. Perhaps we'll have a clearer idea once second quarter earnings releases begin in July as to company forecasts for the second half of 2018, as well as more well-defined Central Bank and geopolitical policies and agendas.


