Which is the better vehicle for playing gold: gold shares or gold bullion? Gold shares (ARCA:GDX) and gold have both been in an uptrend since the GFC, but the goldprice has provided far better risk adjusted returns. Over the last 6.5 years, the gold price has increased by an average 9.0% pa with a volatility of 18.8%. GDX’s total return has been 6.0% pa. over the same period with a volatility of 41.7%.
The respective return/volatility ratios have been 47.8% (gold) and 14.5% (GDX), indicating that gold has considerably outperformed GDX on a risk-adjusted basis.
Does this mean that GDX is now primed for outperformance?
We thought we would examine this question through the lens of our fair value model. This estimates the fair value of the two alternatives based on a multiple regression analysis of their price on 22 driver variables including interest rates, stock indices, other commodities and exchange rates. The database is 6.5 years of daily prices sourced from eoddata.com.
The regression coefficients are multiplied by the current prices of the driver variables. Added to the intercept this gives a current estimate of fair value.
If properly specified, the model, by indicating which of the two currently represents better value, should point to which may offer better risk-adjusted returns going forward.
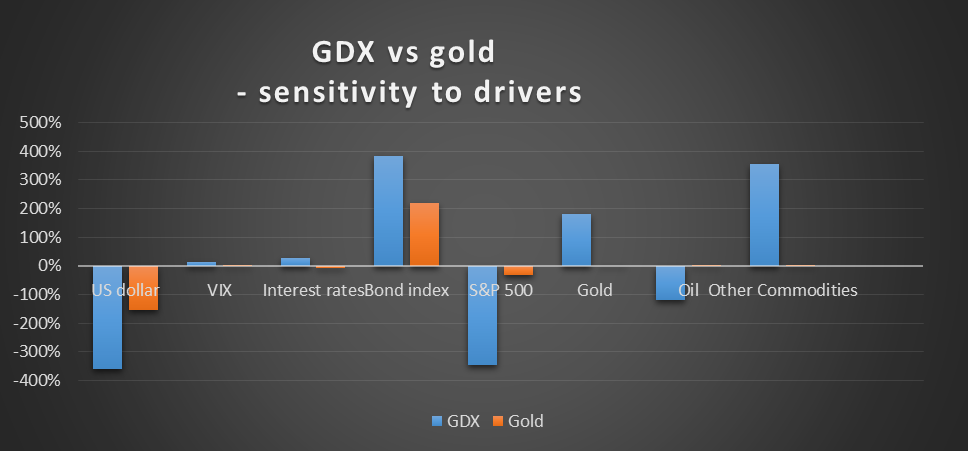
The graph below provides comparative profiles of GDX and gold in terms of their sensitivity to key driver variables –

The graph indicates that as regards the USD, US stock market and bond market drivers, both vehicles are influenced in the same direction – but GDX is far more sensitive. Gold is considerably less leveraged to other commodity prices than GDX.
The positive correlation to the bond index is not surprising given that higher interest rates increase the opportunity cost of holding gold. This effect is exacerbated by the strengthening of the USD that could be associated with higher US interest rates.
The fair value of GDX using this model is well below the current price of $19.36. In contrast, the fair value of gold is comfortably above the current price of $1179. Gold bullion is therefore assessed as better value on fundamentals than GDX.
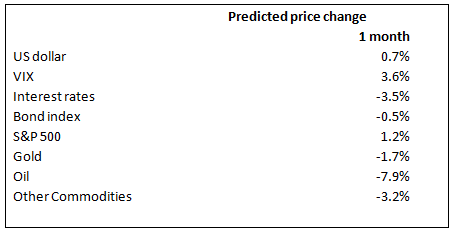
We can also make an attempt at estimating the short term price movement in each vehicle using a lead indicator approach. For each of the 22 driver variables in our fair value model, a related index has been selected as such a lead indicator. Regressions were run to estimate the (lagged) relationship between the driver variables and the lead indicators, from which forecasts were derived of each of the driver variables. The results are as follows:

(The percentages are of the relevant price – eg. the -3.6% applying to “interest rates” means a reduction in the US 30 Year bond rate from 2.61% to 2.52%).
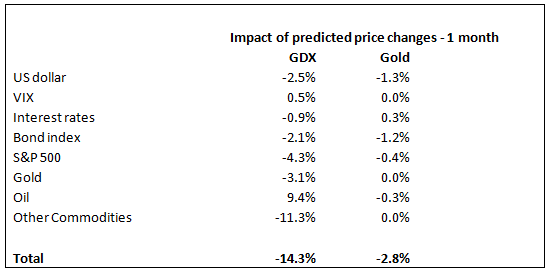
Combining these estimates with the sensitivity factors from the fair value model shown in the graph above, we build up to a more bearish short term view of GDX than gold –

A similar directional picture emerges when forecasting GDX and gold directly from lead indicators – decreases of 3.3% and 1.7% respectively.
The diversification benefits fromcombining trading strategies for gold and GDX based on the lead indicator model with a US-centric stock portfolio came out as similar. Allocating 5% to gold traded using the lead indicator model would have increased the annualized return/volatility ratio from 100.5% (100% S&P 500) to 106.4% over the last 6.5 years. An allocation of 5% to trading GDX would have given 106.3%.
