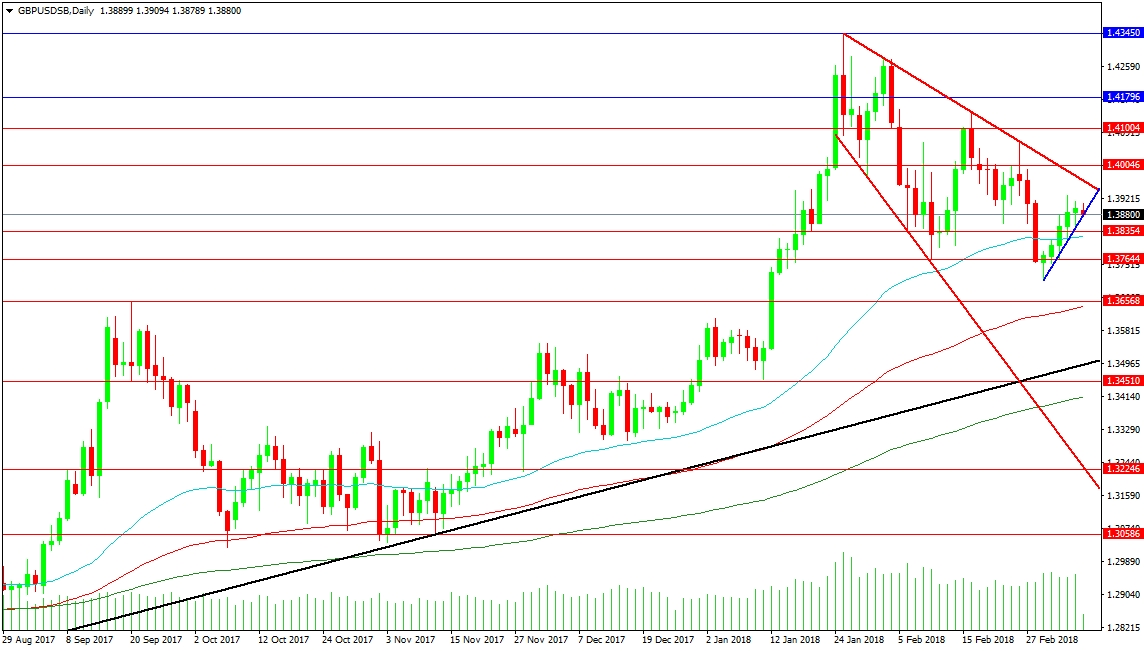
The GBP/USD pair has formed a descending wedge pattern, with the top of the pattern at 1.39608, just below the 1.40000 level. This level has seen price consolidate around it since the end of January. Resistance can be found above the pattern at 1.40046, with touches on the trend line at 1.40695 and 1.41443 centred on the 1.41000 round number level. Higher levels of resistance can be seen at the 1.41796 level, with an intermediate high at 1.42776 and the 2018 high at 1.43450.
Support is located at 1.38354 and the 50-period MA at 1.38245, with the 1.37644 level a low from early February. The September 2017 high is found at 1.36568, close to the rising 100 DMA at 1.36447. The major rising support trend line, shown on the chart in black, is climbing closer to the 1.35000 level, with the 1.34510 level close by and the 200 DMA rising at 1.34115.
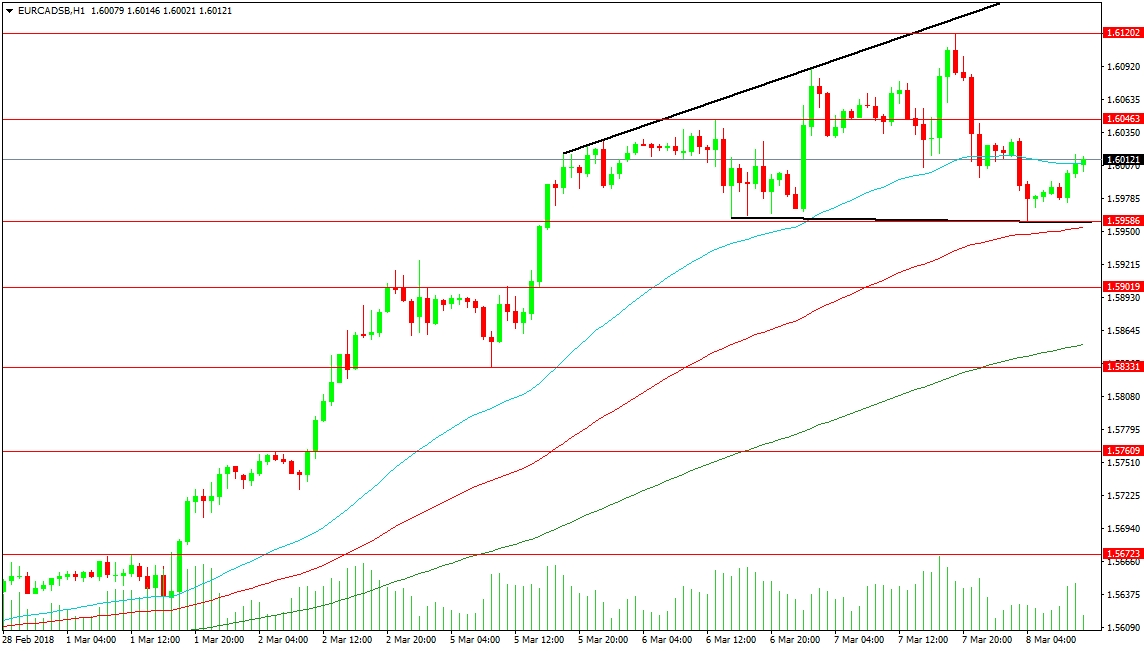
This pair is currently consolidating around 1.60000 and using the 50-period MA on the 1-hour chart. Resistance comes in at 1.60463, with the 1.61202 area as the high from recent market price action. The price is holding above 1.59586 and trend line support, with the 100-hour MA at 1.59535. A drop below this area would create another lower low and target support at 1.59019, followed by the 200 DMA at 1.58530 and 1.58331. Below this area, there is a gap in support until 1.57609. The 1.57000 level can be targeted in extension, with the 1.56723 close below.
Should the current price action form a Head and Shoulders pattern, traders would aim for a target around 1.58000, on the condition of a break below the 1.59500 area once the right shoulder is formed.
Which stock should you buy in your very next trade?
With valuations skyrocketing in 2024, many investors are uneasy putting more money into stocks. Unsure where to invest next? Get access to our proven portfolios and discover high-potential opportunities.
In 2024 alone, ProPicks AI identified 2 stocks that surged over 150%, 4 additional stocks that leaped over 30%, and 3 more that climbed over 25%. That's an impressive track record.
With portfolios tailored for Dow stocks, S&P stocks, Tech stocks, and Mid Cap stocks, you can explore various wealth-building strategies.


