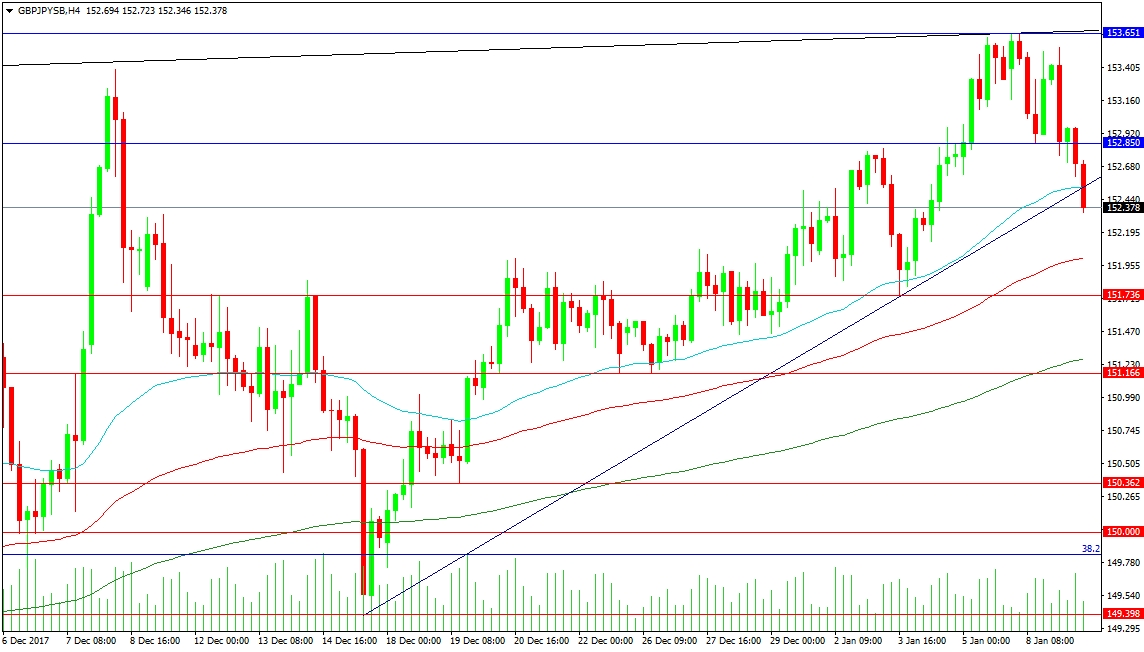
GBP/JPY has been trending higher of late, reaching a high of 153.651 during yesterday’s trading session. This has led to a decline today and a break under key support at 153.000 and 152.850. In fact, the supporting trend line from the middle of December had been tested and failed earlier today, despite being supported by the 50-period moving average in a 4-hour time frame. The 100 period 4-hour MA is located at 152.008 and can lend support to the 152.000 level. Last week’s low is located at 151.736 and the 200 period 4-hour MA is around the 151.268 level.
For the price to reverse the retracement and continue the trend higher it needs to regain the 50-period MA, which had been used as support over the last 3 weeks, and retest this year’s high, at which point resistance is then located at 154.000. This could be hard to achieve as a result of the Bank of Japan reducing Bond purchases overnight, sending Yen crosses through important technical levels on the charts.
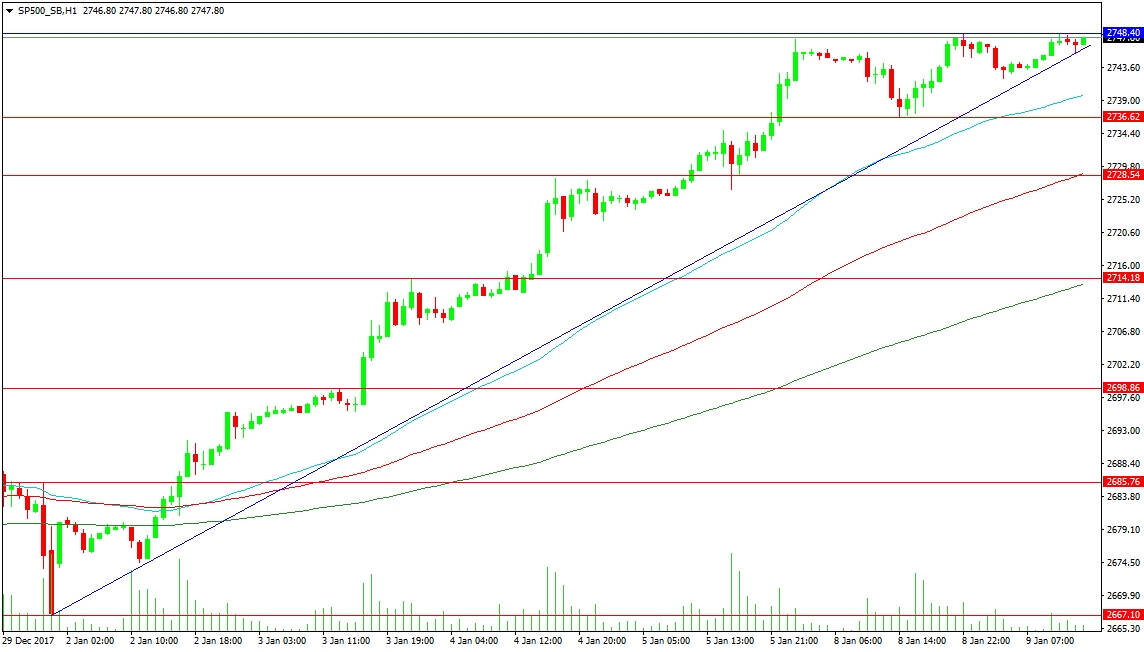
The US index has been in a strong rally since the break above 2700.00. The high of 2748.40 was achieved only yesterday, so there is plenty of optimism on the chart. The steep rally that started on the first trading day of the New Year has cooled a little but is supported by the rising trend line followed by the 50-period 1-hour MA at 2739.77. The most recent low is located at 2736.62 and the 100-period 1-hour MA is around 2728.54, which is a previous level of resistance itself, and this combination should provide a degree of support should a retracement occur. Similarly, it can be argued that the 200-hour MA is closely associated with the previous resistance at 2714.18.
A drop back to 2700.00 or 2698.85 would excite bears but it would take a fall under 2685.76 to worry bullish traders, with major support at 2667.10, the closing level of 2017. For now, the trend remains bullish and the levels of support remain opportunities to ‘buy the dip’. Overhead targets of 2750.00 and 2768.00 remain to be tested.


