
Garmin Ltd. (NASDAQ:GRMN) reported better-than-expected third-quarter 2017 results with revenues and earnings surpassing the Zacks Consensus Estimate.
Earnings of 75 cents per share beat the consensus mark by 9 cents. Earnings were down 17.3% sequentially but stayed flat year over year.
The results were driven by solid performance in marine, outdoor and aviation segments. Auto and Fitness segment revenues declined year over year.
Product line expansion remains the top priority for Garmin. In the quarter, the company launched Descent dive watch, Impact bat swing sensor and TXi series of touchscreen flight displays with engine monitoring solutions. The company also unveiled new wearables including vívoactive 3, vívomove HR, vívosport and vívofit jr. Garmin partnered with Amazon (NASDAQ:AMZN) to launch Garmin Speak, a device that brings full range of Alexa skills inside car.
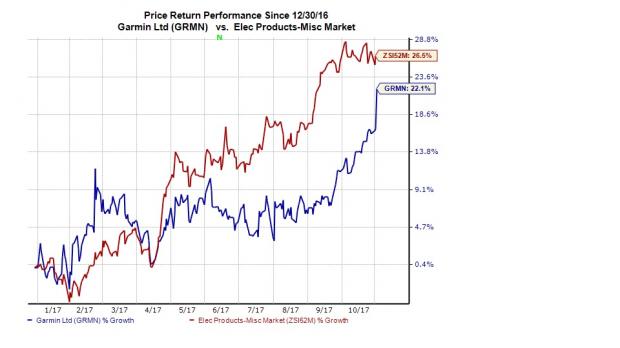
Management focuses on continued innovation, diversification and market expansion to explore growth opportunities in all business segments. However, macroeconomic challenges remain part of the operating environment. We observe that shares of Garmin have gained 22.1% year to date, underperforming the industry’s 26.5% rally.
Let’s check out the numbers.
Revenues
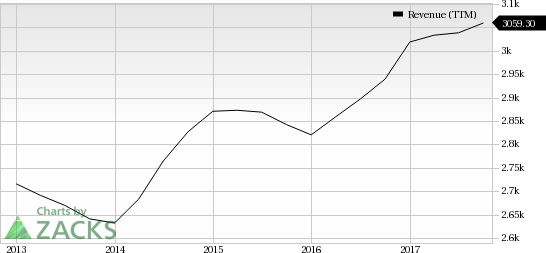
Garmin’s third-quarter revenues of $743.1 million beat the Zacks Consensus Estimate by $25 million and were down 9% sequentially but up 2.9% year over year. The year-over-year increase was backed by higher demand across outdoor, marine and aviation segments.
Garmin Ltd. Revenue (TTM)
Revenues by Segment
Garmin’s Auto/Mobile, Outdoor, Fitness, Aviation and Marine segments generated 25%, 25%, 23%, 17% and 10% of quarterly revenues, respectively. Seasonality results in considerable variations in Garmin’s quarterly revenues.
The Fitness segment decreased 7.7% sequentially and 11.6% year over year. The year-over-year decline was due to lower volumes in basic activity trackers and the timing of product introductions, partially offset by strength in the running category.
Aviation segment revenues were up 0.5% sequentially and 16% year over year. The increase was mainly driven by higher sales of aftermarket products and positive contributions from OEM products.
Outdoor revenues were down 5.1% sequentially but up 31.2% year over year, driven mainly by robust demand for wearables.
The Marine segment decreased 28.8% sequentially but increased 10.4% year over year. The year-over-year growth was driven by strength in chartplotter and fish finder products.
The Auto/Mobile segment was down 9.3% sequentially and 11.9% on a year-over-year basis. The year-over-year decrease was mainly due to shrinking of the personal navigation device (PND) market, partially offset by OEM growth and strength in niche categories such as fleet, camera, truck and RV.
Revenues by Geography
While America generated 46% (down 12.1% sequentially and 2.2% year over year) of total revenues, EMEA and APAC contributed 39% (down 7.2% sequentially but up 6.4% year over year) and 15% (down 3.5% sequentially but up 11.1% year over year), respectively.
Operating Results
Gross margin was 58.4%, down 14 basis points (bps) sequentially but up 215 bps year over year. Stronger demand drove volumes across all segments except Auto, pulling up segment gross margins on a year-over-year basis.
Operating expenses of $263.9 million were up 7.1% from $246.4 million in the year-ago quarter. Operating margin of 22.8% was up 75 bps year over year due to an increase in operating income.
GAAP net income was $147.4 million or 78 cents per share compared with $125.1 million or 66 cents per share a year ago.
On a pro-forma basis, excluding foreign currency effects net of tax, Garmin reported net income of $140.6 million compared with the year-ago figure of $141.3 million.
Balance Sheet
Inventories were up 9.5% sequentially to $575.3 million. Cash and marketable securities were approximately $1.14 billion compared with $1.11 billion in the previous quarter. The company has no long-term debt.
As of Sep 30, the company generated cash flow of $462.6 million from operating activities. Moreover, it spent about $287.3 million on dividends and approximately $74.5 million on share repurchases. The company has $1 million remaining under its share repurchase program through Dec 31, 2017.
2017 Guidance
The company raised its guidance for full-year 2017. Management expects revenues of $3.07 billion compared with the prior expectation of $3.04 billion, and pro-forma earnings of $2.90 per share compared with $2.80 per share expected earlier. Currently, the Zacks Consensus Estimate for revenues and earnings for 2017 is pegged at $3.04 billion and $2.79 per share, respectively.
Zacks Rank and Stocks to Consider
Garmin currently has a Zacks Rank #3 (Hold).
Better-ranked stocks in the broader technology sector are Lam Research Corporation (NASDAQ:LRCX) , NVIDIA Corporation (NASDAQ:NVDA) and Micron Technology Inc. (NASDAQ:MU) , each sporting a Zacks Rank #1 (Strong Buy). You can see the complete list of today’s Zacks #1 Rank stocks here.
Long-term earnings growth for Lam Research, NVIDIA and Micron is projected to be 14.8%, 11.2% and 10%, respectively.
More Stock News: This Is Bigger than the iPhone!
It could become the mother of all technological revolutions. Apple (NASDAQ:AAPL) sold a mere 1 billion iPhones in 10 years but a new breakthrough is expected to generate more than 27 billion devices in just 3 years, creating a $1.7 trillion market.
Zacks has just released a Special Report that spotlights this fast-emerging phenomenon and 6 tickers for taking advantage of it. If you don't buy now, you may kick yourself in 2020.
Click here for the 6 trades >>
Garmin Ltd. (GRMN): Free Stock Analysis Report
NVIDIA Corporation (NVDA): Free Stock Analysis Report
Micron Technology, Inc. (MU): Free Stock Analysis Report
Lam Research Corporation (LRCX): Free Stock Analysis Report
Original post
Zacks Investment Research