Quick Take
The ebbs and flows in the Forex market were rather subdued on Monday, with volatility measures dropping to the lowest in the last month as the progressive decrease in vol stays the course. Nonetheless, the new normal is for currency swings of a much larger magnitude than we were used to before all hell broke loose. Besides, with a VIX index still above 50.00 and month/quarter-end to kick in, there is a real potential for increased activity in equity/bond and FX today.
As an aperitif, we’ve seen sudden spikes in the Yen, US Dollar and Aussie crosses during Tuesday’s final fiscal day in the Tokyo fix. At the risk of sounding too reiterative, it’s worth emphasizing that while the short–term picture has worsened for the US Dollar amid the flooding of dollars into the system by the Fed and a better tone in equities, do not underestimate the phase where we are at, in which based on the bullish breakout in the USD index, further upside is still justified.
The rest of FX saw the Canadian Dollar as the weakest link, finding follow through after the emergency dovish move by the BOC (cut rates by 50bp to its lowest bound and started QE). On the flip side, the Aussie drew solid buy-side flows as the Australian PM pulled out the big guns with a very generous fiscal package to combat COVID-19. The Pound extended its impressive run too, although mildly. The remaining currencies (EUR, JPY, CHF, NZD) consolidated.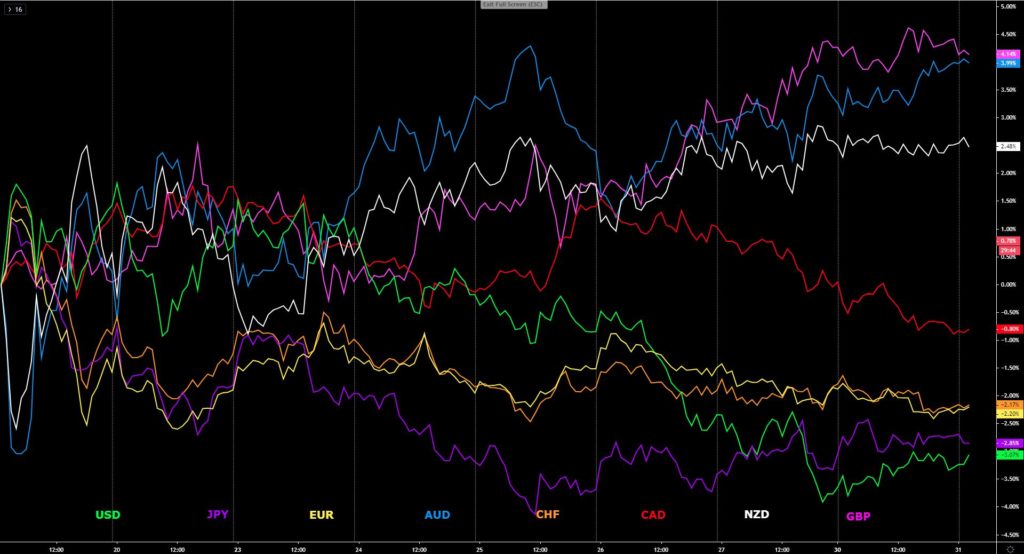
Narratives In Financial Markets
* The Information is gathered after scanning top publications including the FT, WSJ, Reuters, Bloomberg, ForexLive, Twitter, Institutional Bank Research reports.
It’s month/quarter-end in financial markets
This means there is increased potential for equity/bond and FX re-balancing flows. The Global FX Committee (GFXS) issued a statement last week, still applicable for today, in which it warns: “FX participants may execute larger than usual volumes during end-of-month benchmark fixings.
”Equities trade with a better tone
The S&P500 managed to recoup Friday’s losses by rising 3.4%, which could be in part related to month-end re-balancing. In Asia, stocks, especially in the Australian index ASX 200, also traveled northbound (+7%) as detailed emerged of a third fiscal package from the Morrison government.
Trump caves in
Trump extended guidelines on social distancing across the US to April 30, which is a sudden walk-back from his earlier intention to reopen the country. The latest projections by Dr. Fauci, the director of the National Institute of Allergy and Infectious Diseases and a member of the White House coronavirus task, about millions of Americans being infected and estimates of 100,000 to 200,000 deaths appear to have been a wake-up call for the President.
What else is happening?
There has been a worrying rebound in the number of COVID-19 cases in South Korea, while on the flip side, the reported rate of new infections in Italy, Spain or Portugal has slowed down. It’s also encouraging that Ford partnered with GE health to produce ventilators, alongside news that Mercedes F1 team has teamed up with engineers at University College London and UCL Hospital to build a device pumping oxygen to the lungs without the need for a ventilator, with estimates for a production rate of 1,000/day near term.
This DB report digs deeper
For a more in-depth update on how cases have developed globally, the Deutsche Bank Research Team does a great job in this daily report. It underscores that “global cases have risen to over 700,000, with the US driving the bulk of the growth rate.
”Subdued ebbs and flows in Forex
On Monday, currencies traded quietly with the USD regaining some of its lost ‘mojo’. In terms of range expansions, the G8 FX complex averaged much smaller swings as the market takes the foot off the gas pedal end of quarter adjustments. Do not underestimate the phase where we are at, in which based on the bullish breakout in the USD, further upside is likely in weeks ahead. Reuters carries a solid article today to contextualize it.
Oil at lowest in 18 years
WTI crude oil broke below the $20.00 mark, down more than 6%, with the close just above the round number, in what still represents the lowest close since January 2002. Today President Trump talked with Russian President Putin but no breakthrough was reported. I recommend the readership to read the following report by Goldman Sachs titled ‘An Industry Game-Changer’
Germany’s GDP set to collapse
The German economy, so dependable on exports, is in for some rude awakening, as are the rest of global economies to be honest. It nonetheless caught my attention this report by Reuters noting “it could shrink by 5.4% this year due to covid”, Germany’s council of economic advisers said on Monday.
What about the US?
COVID-19 job losses could total 47 million, and the unemployment rate may hit 32%, according to St. Louis Fed projections. “These are very large numbers by historical standards, but this is a rather unique shock that is unlike any other experienced by the U.S. economy in the last 100 years,” St. Louis Fed economist Miguel Faria-e-Castro wrote in a research paper posted last week.
China to go all in to protect jobs
In the following report by JP Morgan, the bank summarizes the March 27th meeting by the Chinese Communist Party (CPC), which is a fresh look at the policy reactions to come, likely to be massive as they are discounting a scenario where the world goes into recession.
Insights Into Forex Majors
This analysis complements one’s view by accounting for multi timeframe biases. Ultimately, it is the traders’ call, via a set of entries thoroughly backtested, to decide if a market meets the prerequisites to enter a position. This analysis is mainly intended as a way to educate traders in upping their analytical skills.
EUR/USD Technical Analysis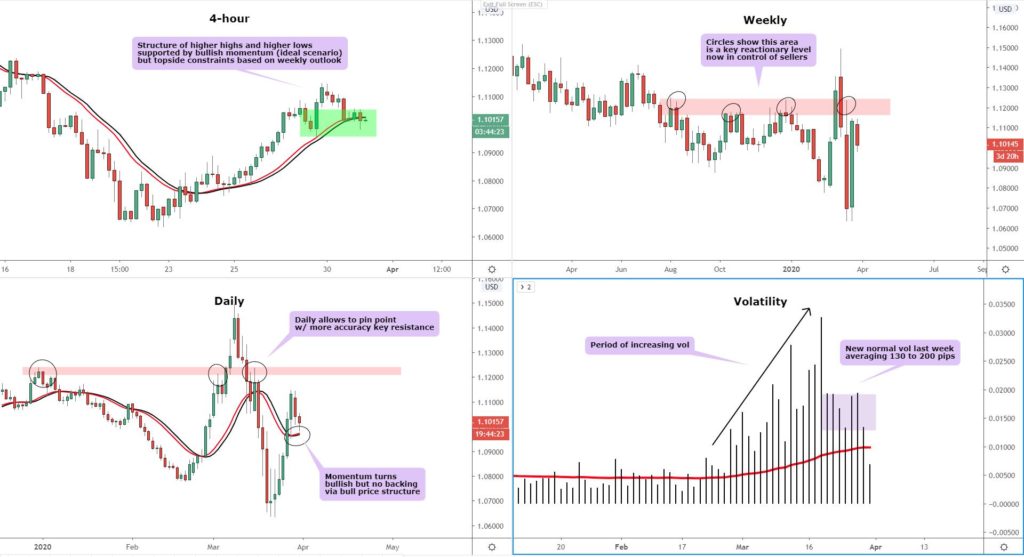
Volatility
It remains above the ‘mean’ as measured by the 100-period moving average, which acts as a great stabilizer of the average vol. However, this is one of the narrowest range since March 10th.
Price structure
The weekly chart has sellers in control after the last successful rotation, as is the case in the daily, where the abrupt rebound off a fresh multi-year low is yet to form higher highs and higher lows. On the 4-hour chart, the bullish case remains valid as the price enters the discounted territory, hence a buy setup would be in line with the bias.
Momentum
The buy-side action, if it were to re-emerge, has the backing of the smart money trackers off the 4-hour and daily. This backdrop is relevant if looking for short-term trading conviction, as it suggests buyers are still the force in control as structure and momentum matches off through the 4-hour chart dynamics.
Key levels
In the big picture, this is a market where sellers have the upper hand subject to the protection of the 1.1170-1.1250 supply area. To the downside, as long as 1.0990-1.10 is protected by not allowing 4-hour closes below, it suggests buying pressure is a real possibility.
Bottom line
While on the big picture the sell-side control is retained, leeway is still available to the upside, which based on the near-term structure and momentum, may materialize but the rally would be limited.
GBP/USD Technical Analysis 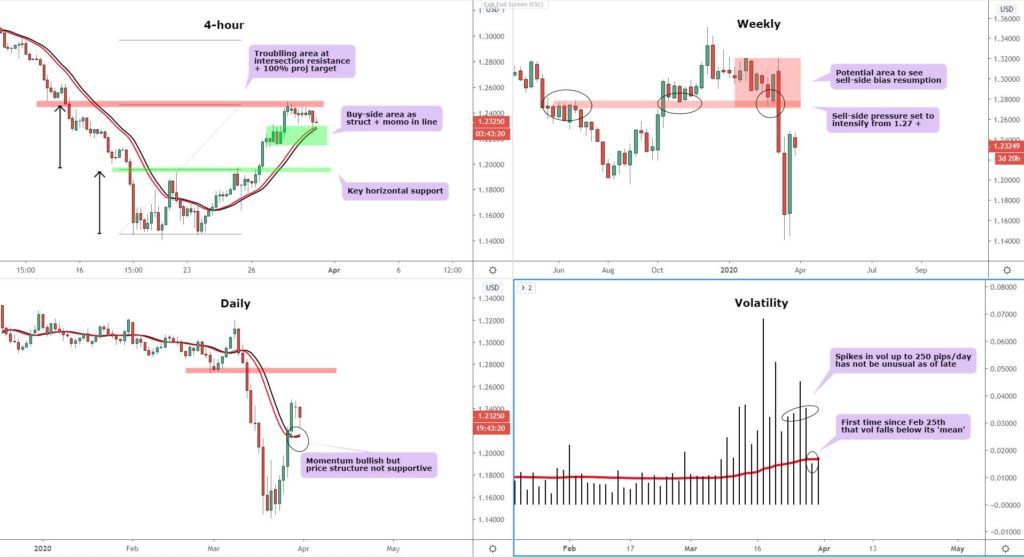
Volatility
It’s the first time since Feb 25th that vol has fallen below its ‘mean’ as measured by the 100-period MA. Nonetheless, recent history suggests this is an anecdote and much higher levels of vol eyed.
Price structure
The bigger timeframes (weekly, daily) communicate sellers are the side in control. However, this view clashes with the near-term technical reality, where buyers have dominated proceedings with the 4-hour still retaining a positive structure.
Momentum
It has turned positive in both the daily and the 4-hour as per the smart money trackers. This bullish setting adds to the case that in the near-term, the 4-hour chart may see further pushes higher.
Key levels
The positive view off the 4-hour must be reconciled with the fact that the 100% bullish projection target has been met. Notwithstanding this overhead constraint, pullbacks are still seen as potential buy-side opportunities within the green box if one’s prop setup shows up. To the upside, assuming the immediate resistance is cleared, 1.27+ becomes the next target for buyers.
Bottom line
The big picture implies the current bullish momentum should be limited in nature, but further room for the Pound to appreciate up towards the 1.27 area is a scenario I can envision based on the current alignment of the 4-hour structure/momentum.
USD/JPY Technical Analysis 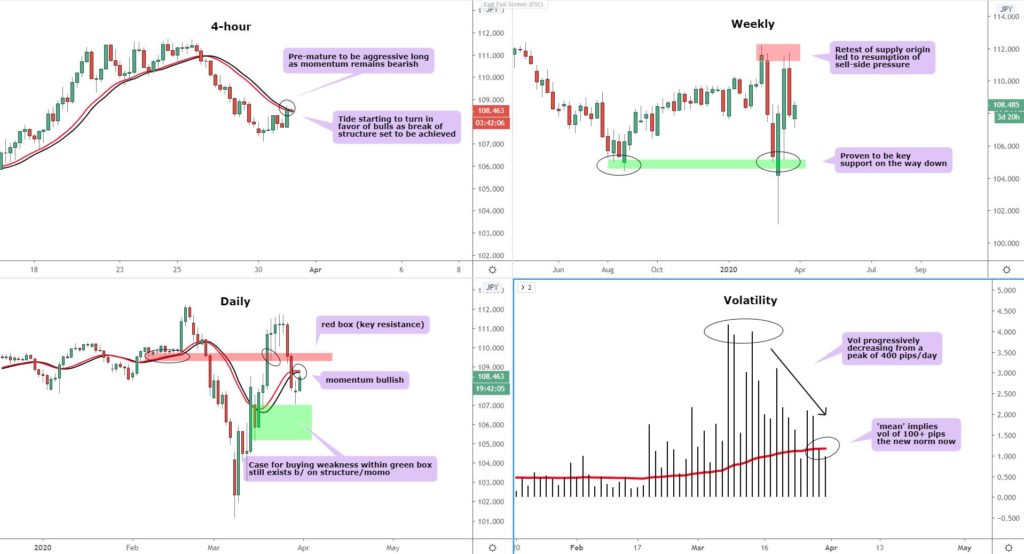
Volatility
The ‘mean’ measurement in red line (100-period MA) implies a vol of 110-115 pips as the new normal. Vol has nonetheless been in a steady decrease since the peaks of 400 pips/day.
Price structure
On the weekly, the bearish forces are dominant, but that’s starting to change off the 4-hour and daily where buyers are now the side that shows the most control of price action.
Momentum
The daily is still the main guidance for those looking to find the backing of momentum via the smart money tracker. The 4-hour still looks pre-mature to be aggressively bullish, but again, this can be seen as being offset by the daily stance.
Key levels
Should the daily bullish momentum extend the area to expect a cluster of offers that may limit the progress starts from 109.30, while on the downside, the green area highlighted yesterday has so far acted as a location for buyers to regain control?
Bottom line
While the weekly is not supportive, the picture clears up in favor of the bulls through the analysis of the 4-hour and daily. Buy-side setups have now the backing of these timeframes structure-wise. In terms of momentum, the daily also shows a case can be made, hence the net balance is a market that justifies buy on dips.
AUD/USD technical analysis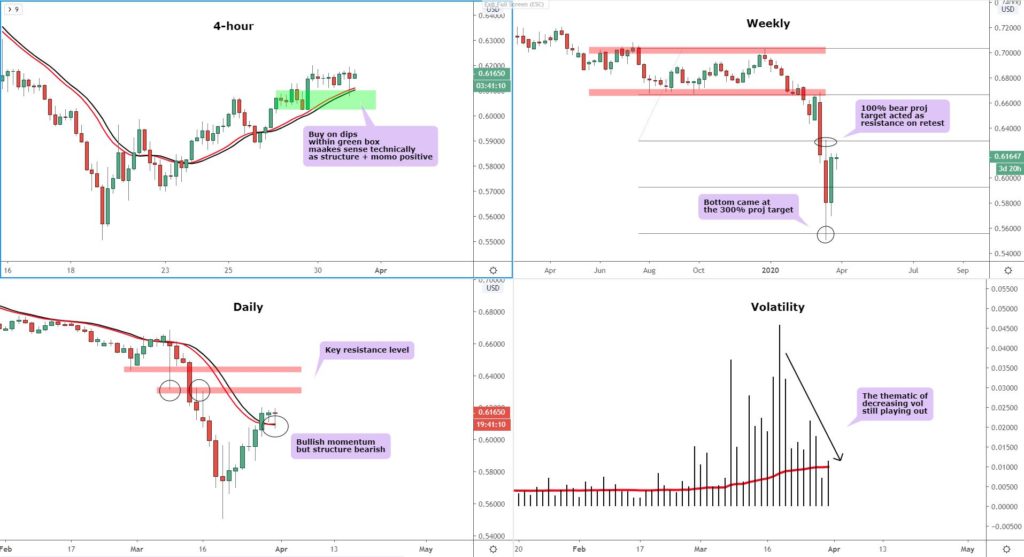
Volatility
The theme of decreasing vol in the Aussie is still playing out with the latest range matching up the new ‘mean’ of about 100 pips.
Price structure
The 4-hour chart is the chart that one must resort to in order to justify higher levels heading into Tuesday as the stepping formation of higher highs and higher lows stay the course. On the bigger timeframes, this is a market where sellers have the upper hand.
Momentum
The 4-hour but also the daily, after a steady appreciation for over 7 days, has allowed the smart money tracker to turn bullish. This reinforces the idea that near term buy-side pressure remains a probable scenario subject to the 4-hour defending its bull structure.
Key levels
The level that I expect the next bullish phase to target if it were to occur, includes the 0.6280-0.6320 ahead of 0.6450. These levels have been highlighted in a red box. To the downside, the green box off the 4-hour portrays where I believe the cluster of limit orders to rest.
Bottom line
The bullish case can be put forward on the basis of the 4-hour structure and momentum. However, as in the case of other major pairs, this bias may not last as the USD macro bull run is unlikely to just simply terminate judging by the bigger timeframe trends.
