At the open of markets on Monday, not much has changed in the FX space since last Friday. However, an important new variable must be thrown into the mix, that is, the open of markets in China, which is set to keep volatility high on speculative flows and position adjustments after the mayhem from last week. For an insight into all the moving parts, keep reading...
Quick Take
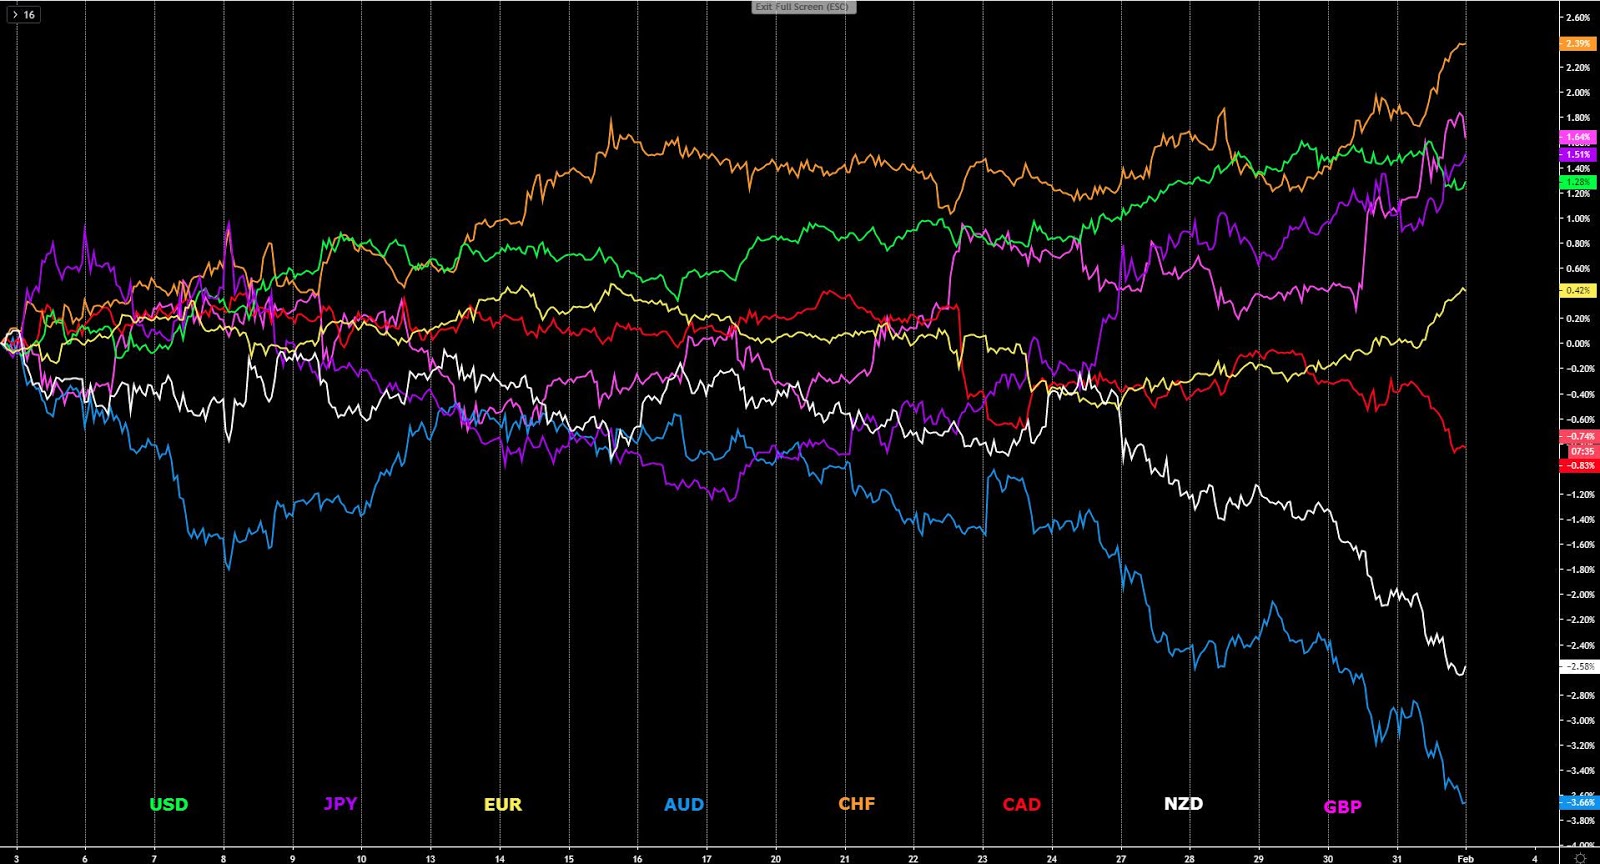
There continues to be no respite to the tightening of financial conditions as depicted by the sharp falls in US equities before the end of business on Friday. The coronavirus-induced risk-off is highly likely to be here to stay for weeks if not months with more research papers indicating that the peak of the disease may still be months away. How it all played out in the currency market was a perfect script of text-book movements to be expected in times of suppressed risk conditions as the prospects of bleak Chinese growth in H1 2020 become an outcome factored-in. So, in forex, the swings were characterized by a surge in the three funding currencies (EUR, JPY, CHF), alongside follow-through demand towards the Pound as the bullish BOE play extended. On the other side of the spectrum, the AUD and the NZD saw another massacre in value, this time also joined by the CAD, which tracked the Oceanic currencies lower in locksteps. The USD, which put on a stellar performance in January in line with seasonals, finally succumbed in what some bank research report appear to attribute to month-end flows redistribution.
Narratives In Financial Markets
* The Information is gathered after scanning top publications including the FT, WSJ, Reuters, Bloomberg, ForexLive, Institutional Bank Research reports.
The Oceanic currencies remain the most punished: The Australian and New Zealand Dollar continue to suffer the consequences of the NCoV as fears of a much deeper-than-thought contraction in China’s and global growth keep mounting. The market is finally coming to the realization that the official numbers (see tracker) shared by Chinese officials are largely manipulated in order not to mitigate mass panic among the population.
Concerning new research paper on the virus: A new research paper published by the reputable site Lancet found that the Wuhan coronavirus cases were at 75,800 as of Jan 25. As part of the conclusions they reached, it was stated that “if the transmissibility of 2019-nCoV were similar everywhere domestically and over time, we inferred that epidemics are already growing exponentially in multiple major cities of China with a lag time behind the Wuhan outbreak of about 1–2 weeks.” It also states that “Large cities overseas with close transport links to China could also become outbreak epicentres, unless substantial public health interventions at both the population and personal levels are implemented.”
Dean of Medici at HKU on the state of the coronavirus: For an objective and educated assessment of the coronavirus, I urge the reader to watch the following video, where Dr Gabriel Leung, Dean of Medicine at the HK University, shares his dire projection as he discusses RO, containment, timing of peak virus and other major talking points.
More airlines join in suspension of flights in and out of China: It’s interesting to note that more US and global airlines are announcing their decision to either suspend China flights indefinitely or for at least 2 months until the end of April. This story is here to stay at least for a few more weeks driving sentiment in the marketplace. The evidence that airlines, such as Delta in the US, are shutting down travel routes to China for the foreseeable future, gives more validity to this prognosys of protracted depressed sentiment.
Lively open of markets in China: The Chinese markets opened in a truly chaotic manner by playing catch up and gaping over 9% lower after the extended holiday break.
The Chinese government announced economic measures to instill calmness. As part of the measures, the PBOC will provide 1.2 trillion yuan via reverse repos. The PBOC also decided to cut rates on RRs. Besides, commodity futures in China are also much lower, with Iron ore for instance limit down. Copper has also suffered. If the proverbial hits the fan via panic selling out of control, the central bank will likely step in by lowering rates further and the government will most likely ramp up fiscal and economic stimulus.
China will limit short-selling on the re-open: According to unnamed sources cited at Reuters, China's regulator (China Securities Regulatory Commission (CSRC)) issued a verbal directive to brokerages to not permit clients selling borrowed stocks when markets re-open on Monday. Therefore, the word is out that China will not allow short selling on their stock markets when they reopen for trade. This could clearly limit, to a certain extent, the downward spiral in selling.
The Pound gaps down to start the week: This follows news on Brexit that the UK PM Johnson is said to be prepared to quit trade talks with the EU. This story has been ‘leaked’ as part of the details of a speech Boris Johnson is set to give to businesses on Monday. The headlines gathered indicate that Johnson aims to have a comprehensive trade deal at least as good as Canada's, while will be ready to take a looser arrangement like Australia's if talks fail. Lastly, Johnson is expected to say that if the UK and EU cannot reach a trade deal he two would do business on World Trade Organization terms in most areas.
What’s ahead in the economic calendar? Monday highlights China’s Caixin reading, Japan and EU (Final) Manufacturing PMIs as well as the US Manufacturing ISM. As the week goes by, the RBA policy meeting n Tuesday will be a key focal point, as will Governor Lowe speech and testimony, alongside the Australian retail sales numbers. To end the week, the markets will have to als account for the RBA SoMP, the NZ and US employment figures. Note, the number one driver, by a country mile, will continue to be the developments in the coronavirus, so keep monitoring the news closely.
Domino effect in easing measures by G8 Central Banks? There may soon be a domino effect by which if the dire predictions on global growth due to the coronavirus accelerating its spread, central banks may soon be forced to act. The first one that comes to mind is the RBA meeting tomorrow, which is unlikely to see any material changes as the recent economic data (jobs, inflation) argue for a hold and give them some leeway before they decide to loosen up financial conditions again. Notice though, a cut in the March RBA meeting is a 50/50 show at this stage. Meanwhile, other Central Banks like the BOC has already laid the ground for lower rates in coming months, with the virus acting as the last straw. A cut in March is priced at 27%. Meanwhile, in the US, a cut at the April FOMC meeting is priced at 60%.
Recent Economic Indicators & Events Ahead
Source: Forexfactory
Insights Into FX Index Charts
Risk Conditions:
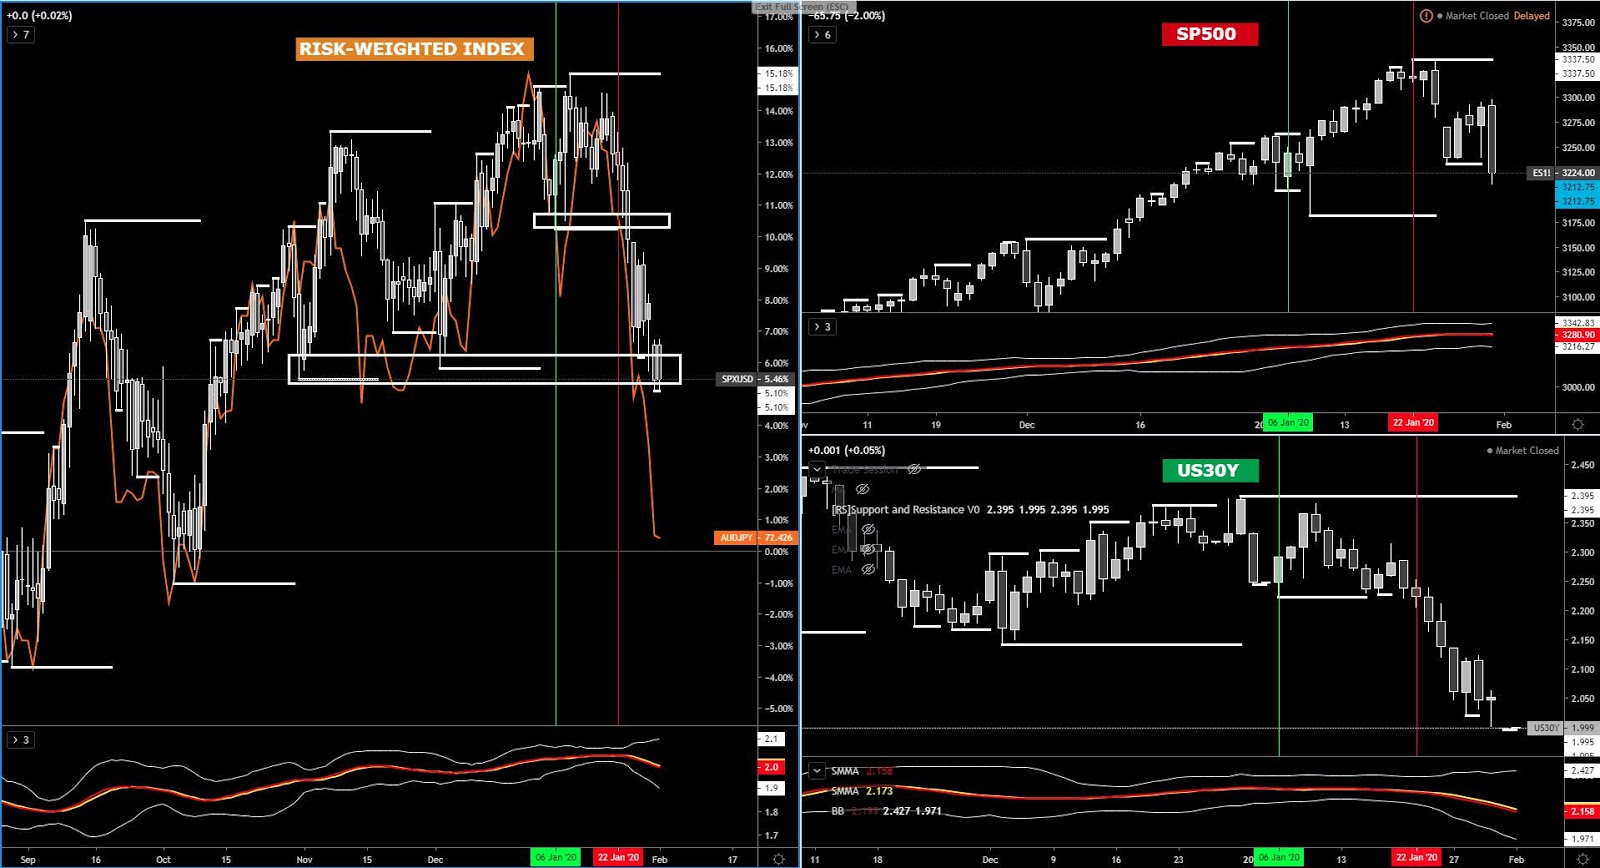
Before diving into the FX space, it’s important to highlight that the risk dynamics continue to look very bleak, after the S&P 500 saw another sharp decline into new cycle lows. Interestingly, this time it was the US 30-year bond yield as the bellwether of global growth and inflation that tamed a tad the magnitude of the decline in the Risk-Weighted Index, which the AUD/JPY (orange line) keeps tracking extremely tightly as a proxy for risk sentiment.
The EUR Index
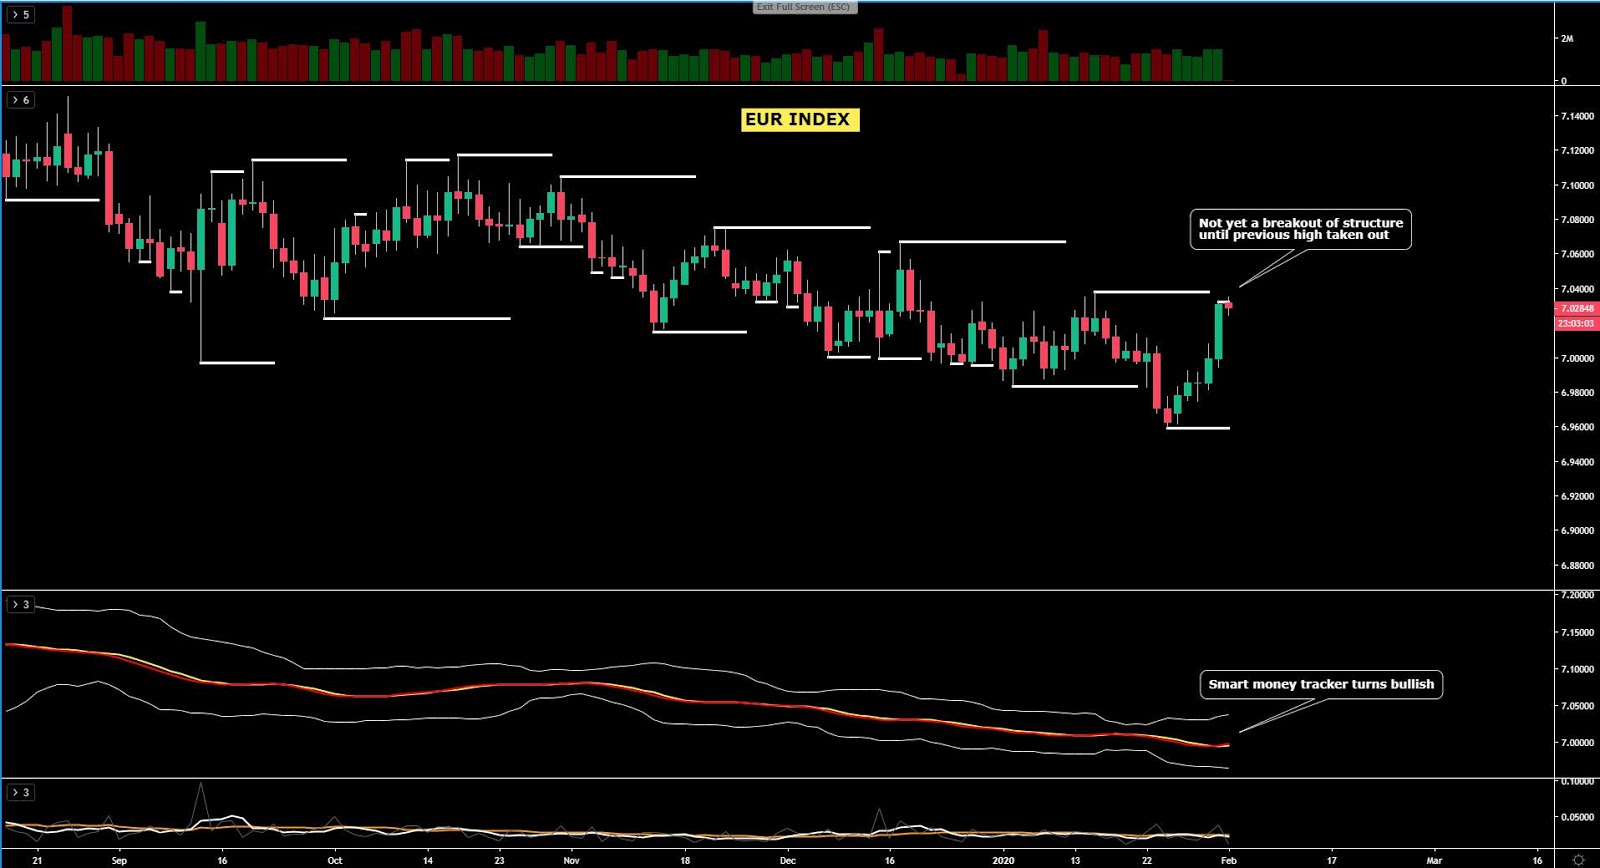
EUR accelerated its upward trajectory in a very strong fashion before the end of the month, a rise that appears to have been aided by month-end flows. The sizeable bullish candle makes the prospects of buying the EUR a very unattractive consideration unless you are a scalper-type trader with the intention to aim for 10-20 pips intraday. I’d be expecting the resistance that lies overhead to be acting as a rotational point back towards a mean measure and hence a chance to sell expensive Euros as this type of large gains, especially in the Euro, have proven to be unsustainable based on the price patterns observed over the past few years.
The GBP Index
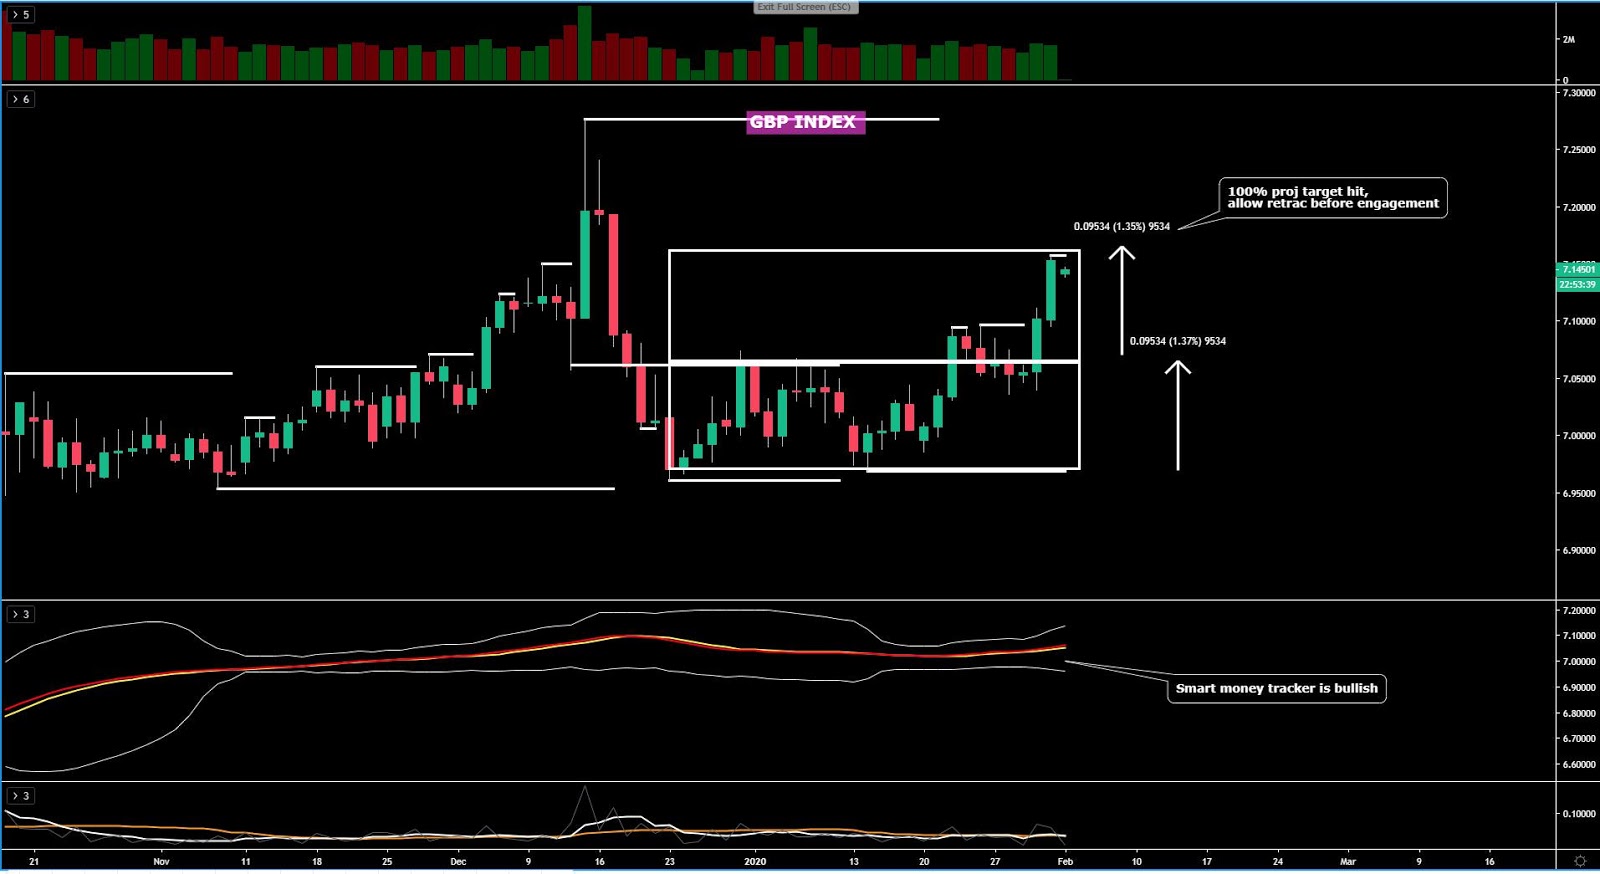
GBP appears to have reached its 100% projection target as anticipated, from where a retracement has ensued as part of a gap down to start the week. Until technicals prove me wrong, what the latest rise does is to reinforce the bullish bias, but remember, you don’t want to engage in long-side business once the 100% measured movement has been hit, that’s a time to let the market go through an offset distribution lower and aim to buy dips. The smart money tracker (2nd window) alongside the price structure support the core buying view.
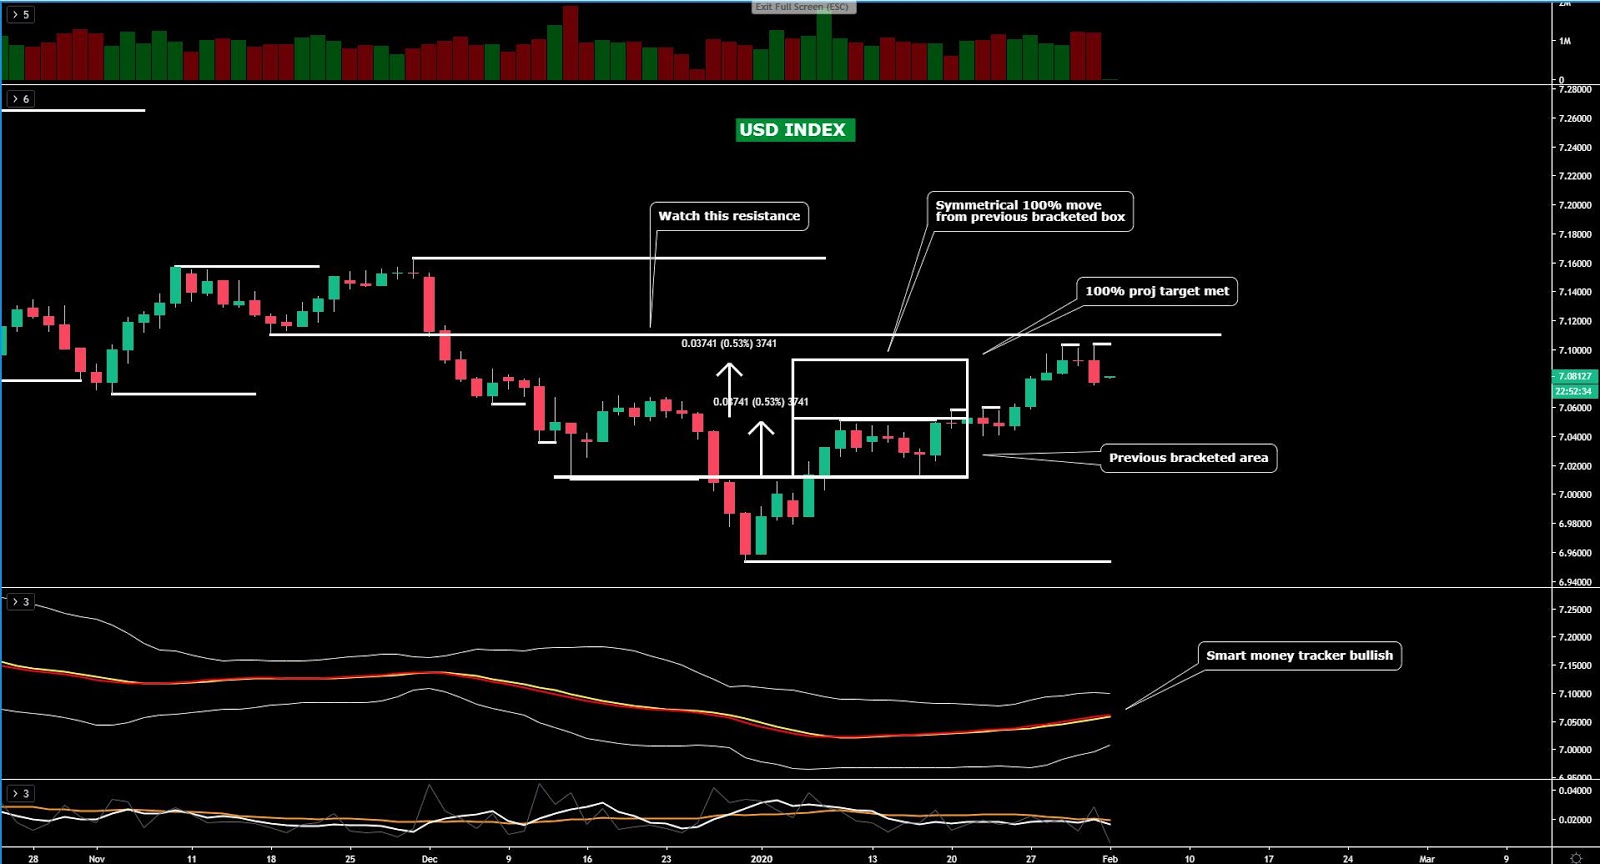
The USD Index
After struggling between the 100% projected target and an overhead resistance, an area that led to a pause in the buy-side flows, USD finally saw a setback last Friday. However, note that this pullback is simply correctional in nature in the context of a rising market that has the backing of the smart money tracker slope and the price structure. What this means is that weakness should be perceived from the standpoint of anticipating buyers to step in. Therefore, aiming to be holding USD long exposure in early Feb makes for a solid case for now.
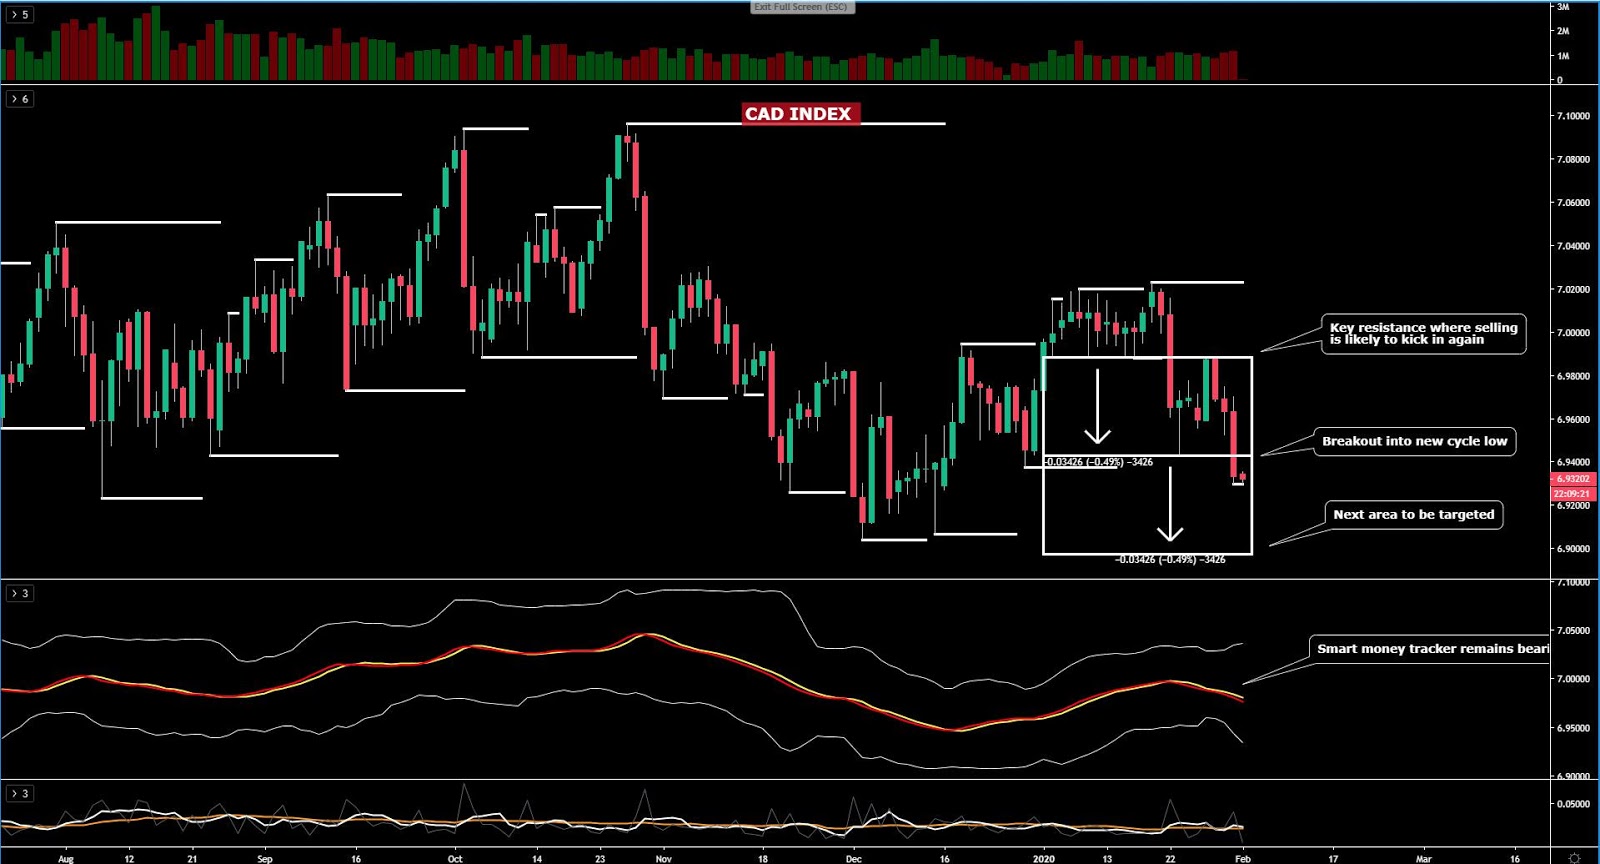
The CAD Index
CAD found further follow through continuation to vindicate the formation of yet another bearish cycle, one that now faces the prospects of a fall to the tune of 0.5% from the breakout point seen last Friday. While fundamentally the CAD carries bearish sentiment on the basis of a more dovish BOC and risk-off dynamics settled in, it also shows technical confirmation that the path of least resistance continues to be lower. The next 100% proj target is where I’d be expecting the currency index to land next, hence MOMO (momentum strategies) may see immediate interest in piling in to keep riding this trend lower.
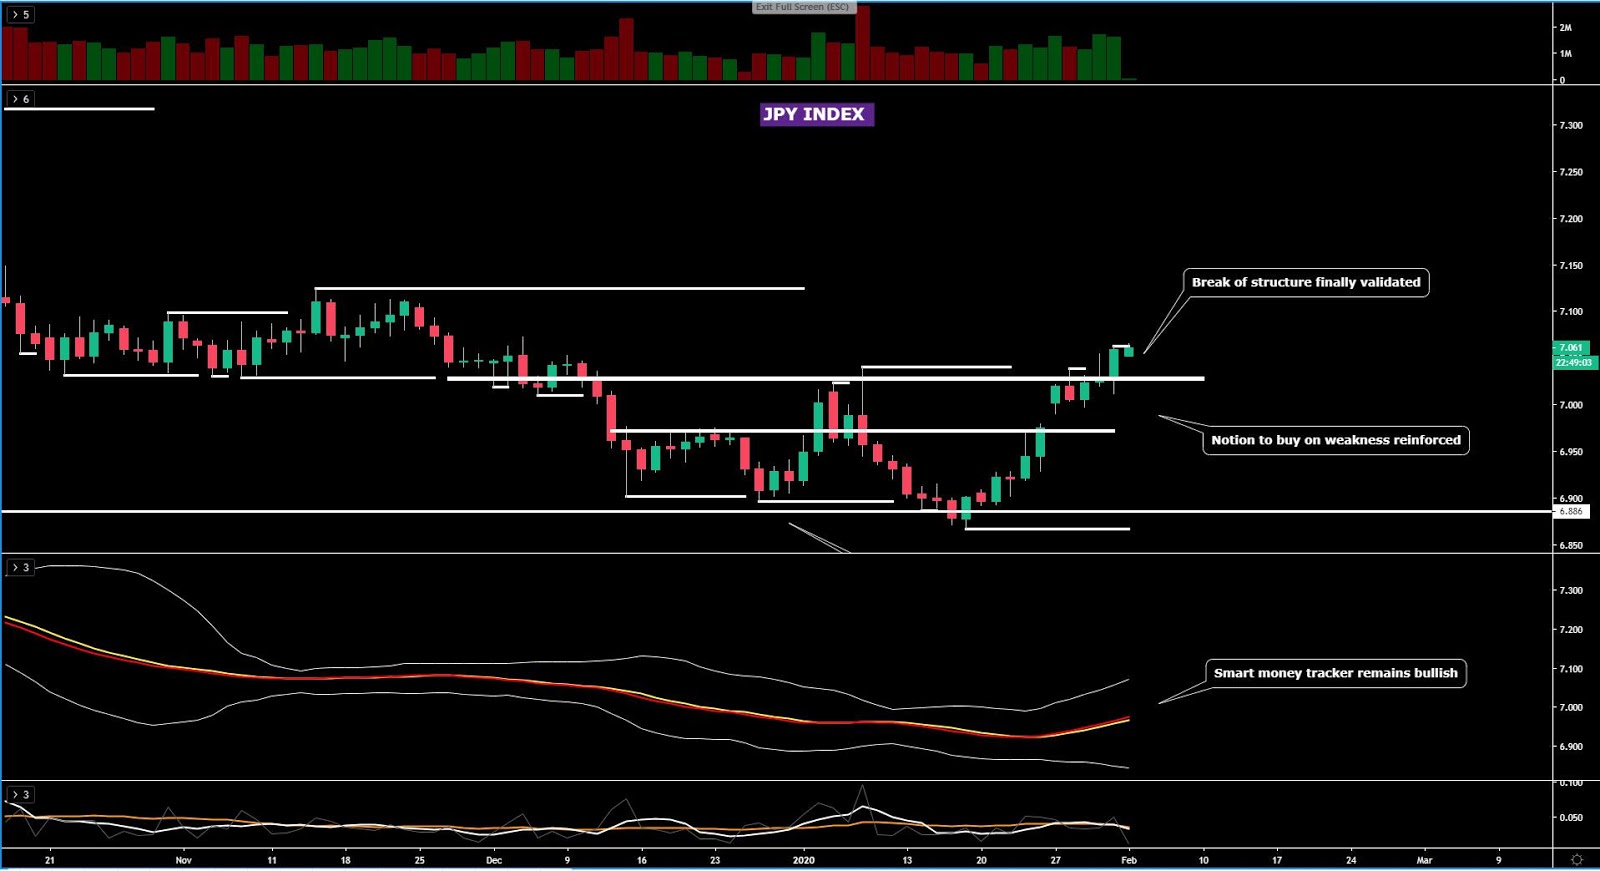
The JPY Index
JPY breached a critical level of horizontal resistance and by doing so, it has validated a transition into a bullish market on the daily chart. The risk-off patch the market is going through should keep the Yen bought up at regular intervals, with the added conviction that now, finally, the price structure is in alignment with the smart money tracker. I keep reiterating that the Yen from the long side remains a dangerous proposition given the substantial gains it’s printed but with the price breakout via an outside bullish candle formation, it depicts undeniable strength with follow-through buying the base case, either off the gates or on shallow dips as the currency index retests the broken resistance point now thought to turn support.
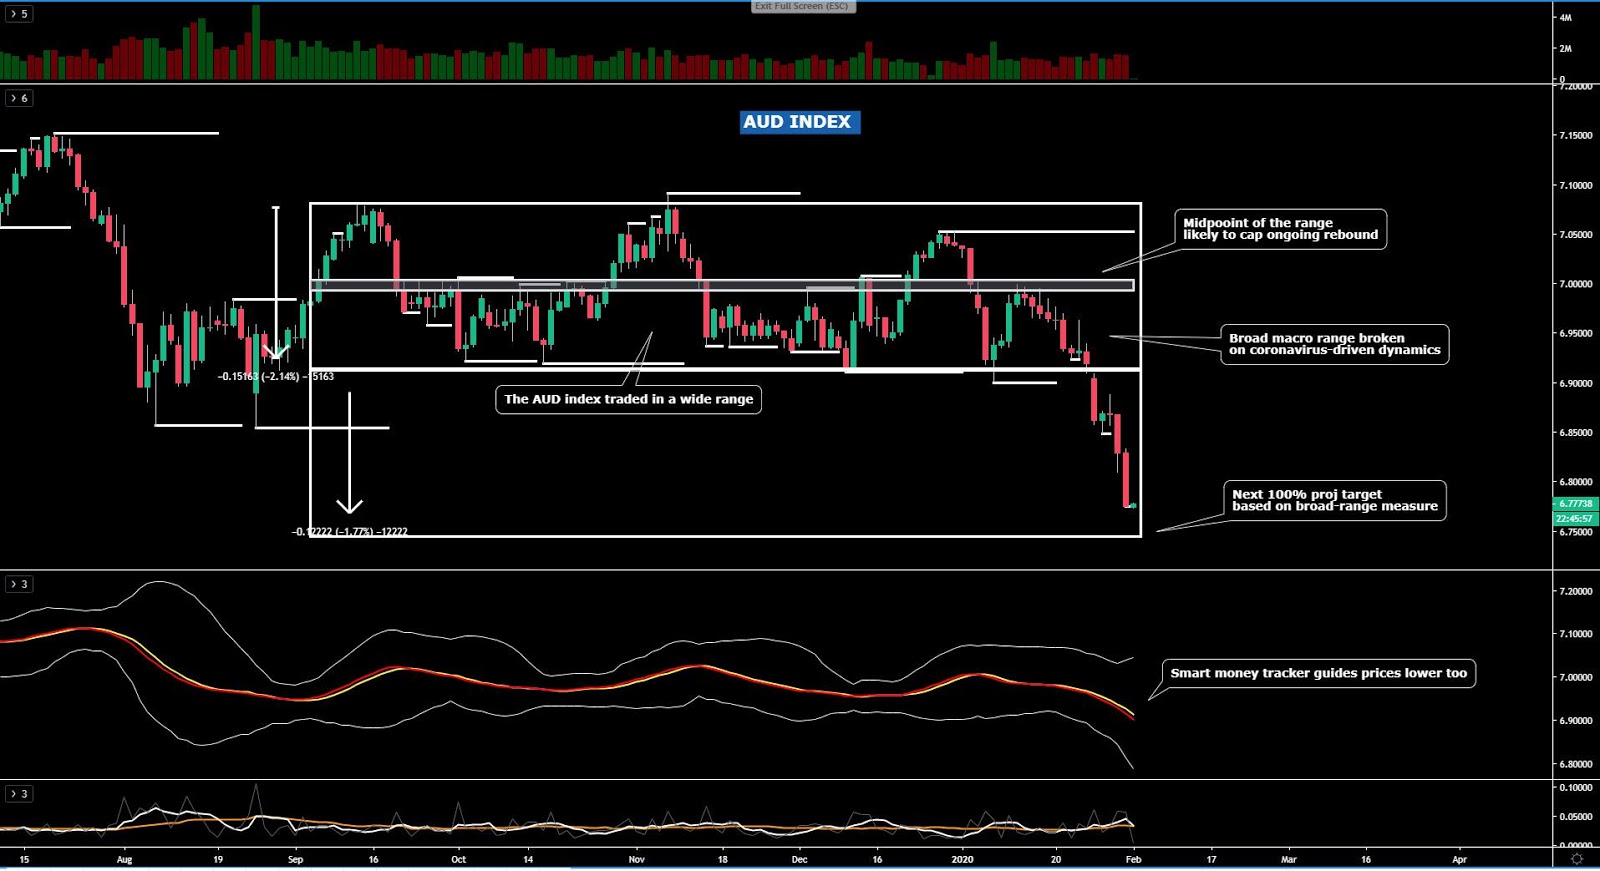
The AUD Index
AUD remains in free-fall, which is forcing me to be more aggressive in the projected area where I’d expect the currency to pause its downward value suppression for the time being. Since the micro 100% measures have not resulted effective in predicting the end of this ongoing bloodbath, I am now looking at the macro 100% projection based off the broad range broken on January 27th. If this turns out to be correct, the Aussie may see an additional 0.4%-0.5% of falls until market makers and profit-taking facilitates a meaningful adjustment of the rate higher. It goes without saying that the outlook is bearish but the levels the Aussie trades at are ridiculously overextended, so again, unless for scalping purposes, stay away from AUD shorts until there is a considerable rebound towards areas of technical significance.
The NZD Index
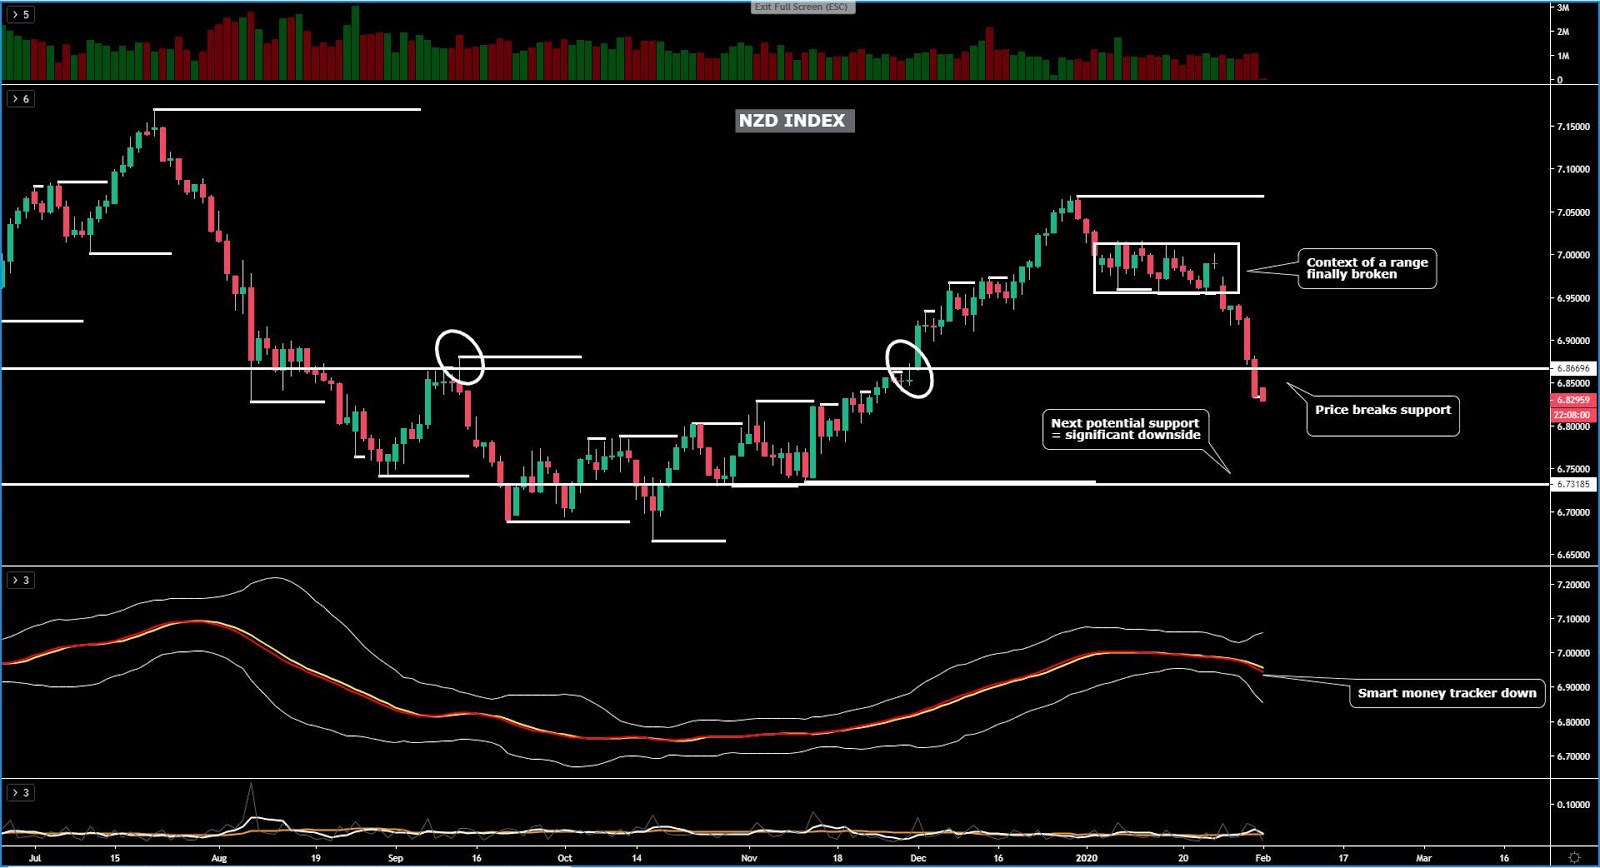
Even if it reached a level in the chart last Friday where a pause of the sell-side pressure could have been expected based on the technicals (support line), the reality is that sentiment continues to trump any technical factor at the moment. It doesn’t matter is Thursday's sell-off looked awfully overextended, the unwinding of longs, the risk-off follow through, and the overall tightening of financial conditions was yet again a recipe for disaster to be long the currency, which as in the case of the Aussie, acts as a proxy to trade China, even if more on the basis of just simply piggy backing the performance of the latter. There appears to still be substantial downside potential in the coming weeks for the NZD.
The CHF Index
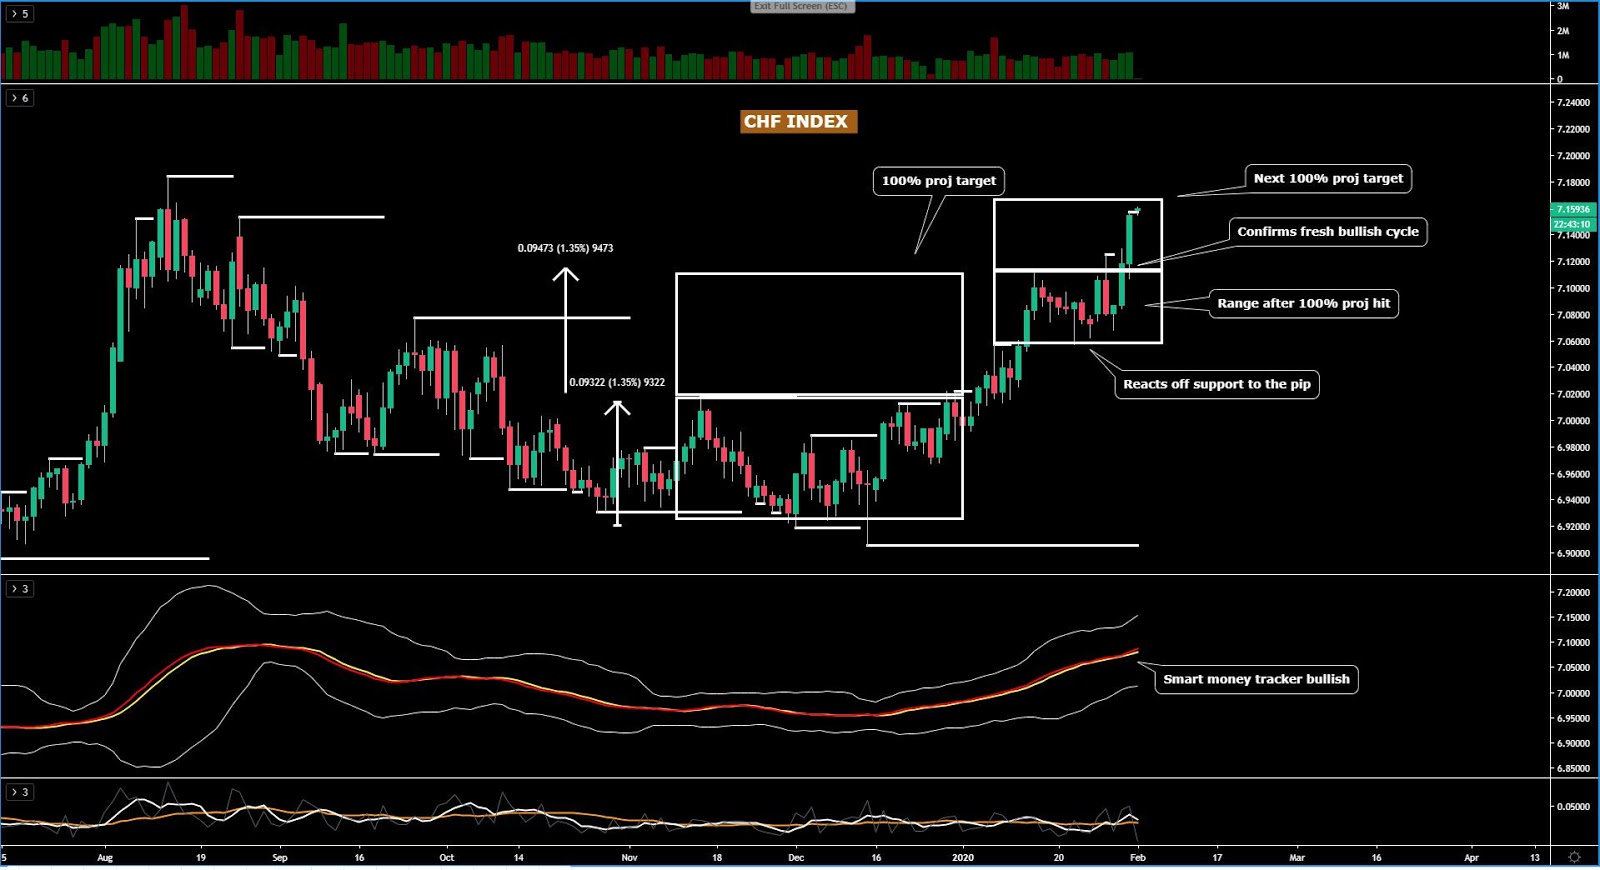
After breaking its 2-week consolidation phase and finally accepting level outside these range parameters last Friday, it went on to see aggressive buy-side business. The rise has now extended towards the 100% measured movement, which means, I’d be expecting a short-term setback in the price of the CHF. Even if the momentum continues, this is not a market fitting most accounts outside those looking for intraday scalping. You’d be better off waiting for a correction into levels of technical significance outside overbought readings.
Important Footnotes
- Market structure: Markets evolve in cycles followed by a period of distribution and/or accumulation.
- Horizontal Support/Resistance: Unlike levels of dynamic support or resistance or more subjective measurements such as fibonacci retracements, pivot points, trendlines, or other forms of reactive areas, the horizontal lines of support and resistance are universal concepts used by the majority of market participants. It, therefore, makes the areas the most widely followed and relevant to monitor.
- Fundamentals: It’s important to highlight that the daily market outlook provided in this report is subject to the impact of the fundamental news. Any unexpected news may cause the price to behave erratically in the short term.
- Projection Targets: The usefulness of the 100% projection resides in the symmetry and harmonic relationships of market cycles. By drawing a 100% projection, you can anticipate the area in the chart where some type of pause and potential reversals in price is likely to occur, due to 1. The side in control of the cycle takes profits 2. Counter-trend positions are added by contrarian players 3. These are price points where limit orders are set by market-makers.
