This past weekend, I discussed how the current rally since the election has been based on “hopes” for tax cuts and tax reforms as there was little evidence currently to suggest it was based on fundamental underpinnings. To wit:
“Do not be mistaken, this ‘rally’ IS all about tax cuts. Despite many who are suggesting this has been a ‘rational rise’ due to strong earnings growth, that is simply not the case as shown below. (I only use ‘reported earnings’ which includes all the ‘bad stuff.’ Any analysis using ‘operating earnings’ is misleading.)”
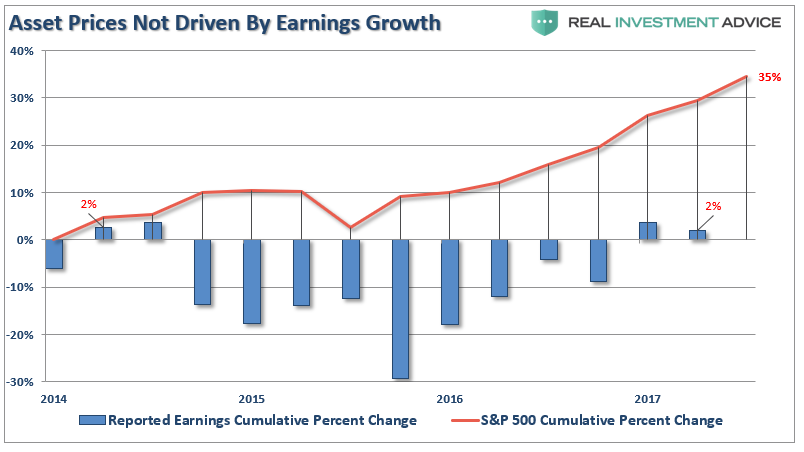
“Since 2014, the stock market has risen (capital appreciation only) by 35% while reported earnings growth has risen by a whopping 2%. A 2% growth in earnings over the last 3-years hardly justifies a 33% premium over earnings.”
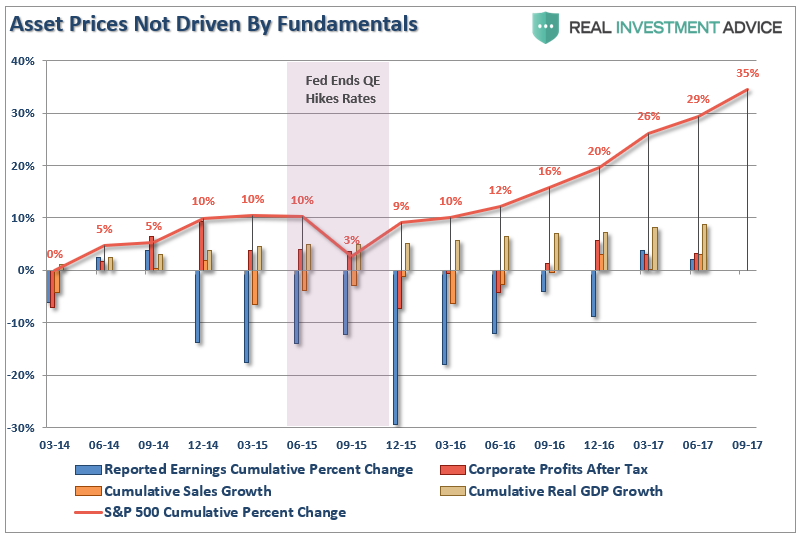
The chart below expands that analysis to include four measures combined: Economic growth, Top-line Sales Growth, Reported Earnings, and Corporate Profits After Tax. While quarterly data is not yet available for the 3rd quarter, officially, what is shown is the market has grown substantially faster than all other measures. Since 2014, the economy has only grown by a little less than 9%, top-line revenues by just 3% along with corporate profits after tax, and reported earnings by just 2%. All of that while asset prices have grown by 29% through Q2.
But despite the data, many on Wall Street are suggesting the recent string of “record highs” is all about improving fundamentals and not about the “Trump agenda.” To wit:
“ SCHW executive Jeffrey Kleintop has a message for supporters of President Donald J. Trump who believe his election is behind recent stock market gains: The rally is not about him.
The president’s advocates attribute the upturn to anticipation of Mr. Trump’s efforts to cut taxes, decrease regulation and increase infrastructure spending. Mr. Kleintop doubts that the president’s anticipated policies have been decisive.
‘The Trump rally doesn’t exist, it’s rooted in the fundamentals.’“
What’s driving the markets upward are corporate sales growth and first-quarter earnings, both of which have registered their biggest gains in several years.”
Looking at the data above, not so much.
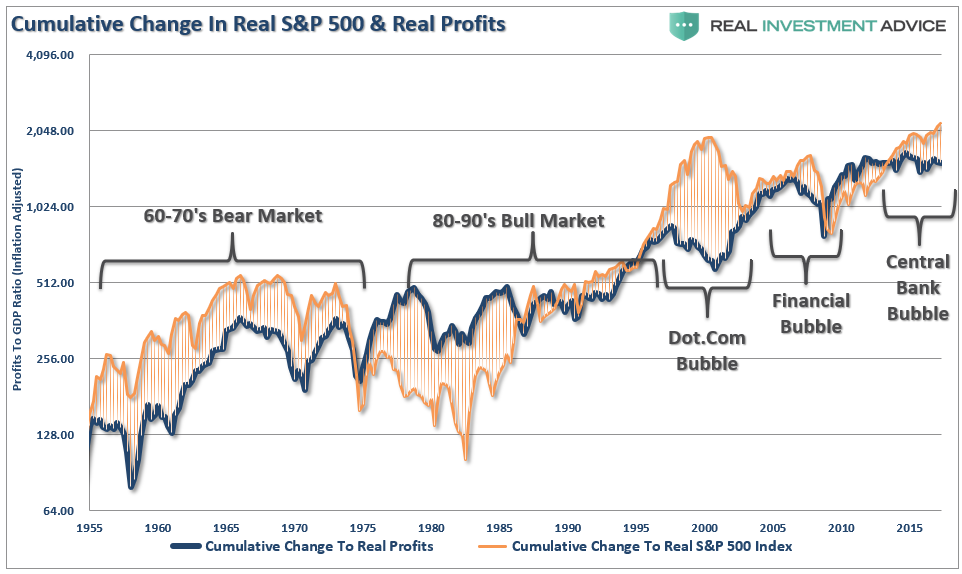
But let’s expand this data even more back to 1955. The chart below is an expansion of the real, inflation-adjusted, profits after-tax versus the cumulative change to the S&P 500. Here is the important point – when markets grow faster than profitability, which it can do for a while, eventually a reversion occurs. This is simply the case that all excesses must eventually be cleared before the next growth cycle can occur. Currently, we are once again trading a fairly substantial premium to corporate profit growth.
Since corporate profit growth is a function of economic growth longer term, we can also see how “expensive” the market is relative to corporate profit growth as a percentage of economic growth. Once again, we find that when the price to profits ratio is trading ABOVE the long-term linear trend, markets have struggled and ultimately experienced a more severe mean reverting event. With the price to profits ratio once again elevated above the long-term trend, there is little to suggest that markets haven’t already priced in a good bit of future economic and profits growth.
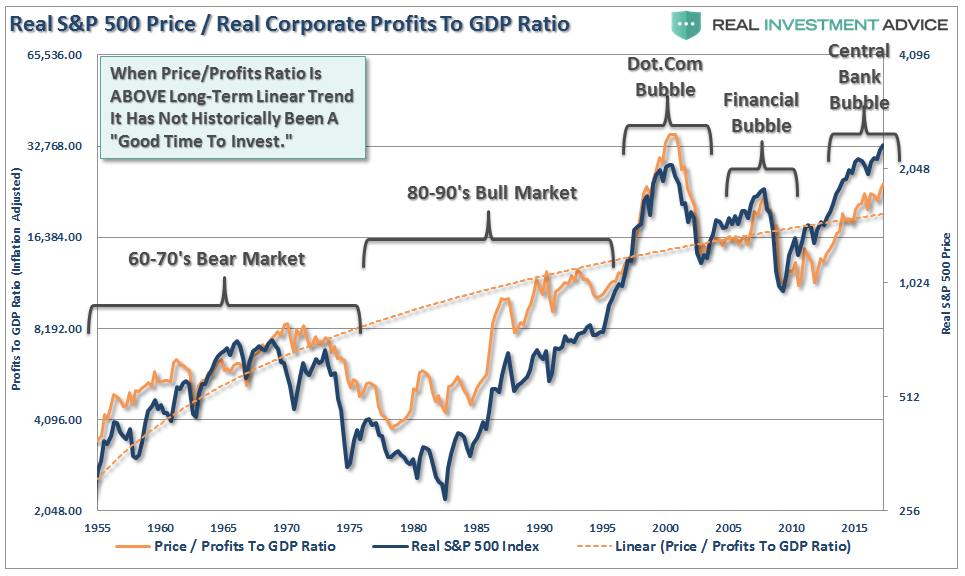
While none of this suggests the market will “crash” tomorrow, it is supportive of the idea that future returns will substantially weaker than in recent years.
No, We Aren’t In A New Secular Bull Market
Are we in a strongly trending “cyclical” bull market currently? Absolutely.
Are we in a long-term “secular” bull market as witnessed in the 80-90’s? Absolutely not.
Jeffrey Saut, the chief investment strategist at Raymond James, currently believes the latter. He suggests there may be nearly a decade left in this “secular bull” market, which is defined as a market that’s driven by forces that could be in place for years.
“I say secular bull markets last 16, 17, 18, 19, 20 years. And even if you start the measuring point in March of ’09, you still ought to have another seven, eight, nine years left in this thing. This is going to be the longest, strongest secular bull market of my career and I’ve been in the business 47 years.”
Personally, I hope he’s right as it would sure make my job of managing money easier for my clients.
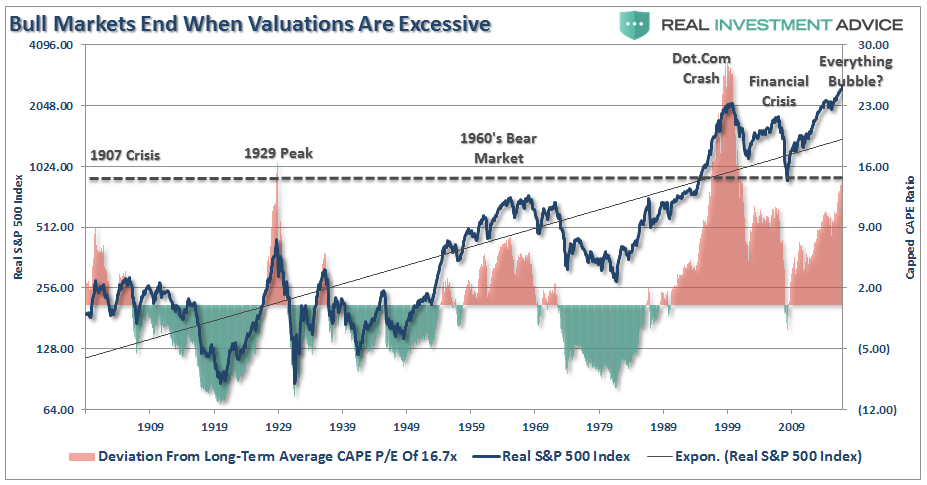
However, as noted above, and as shown below, “secular bull markets,” which are long-term growth trends, have never started from 15x valuations and immediately surged to the second highest level on record. Historically, as shown below, secular bull markets are born of excessive pessimism and low valuations that stay in place for years as earnings and profitability grow faster than prices (keeping valuations lower.) Despite Mr. Saut’s hopes, that is simply not the case today as valuations exploded as earnings, economic and profit growth lagged the liquidity induced surge in asset prices.
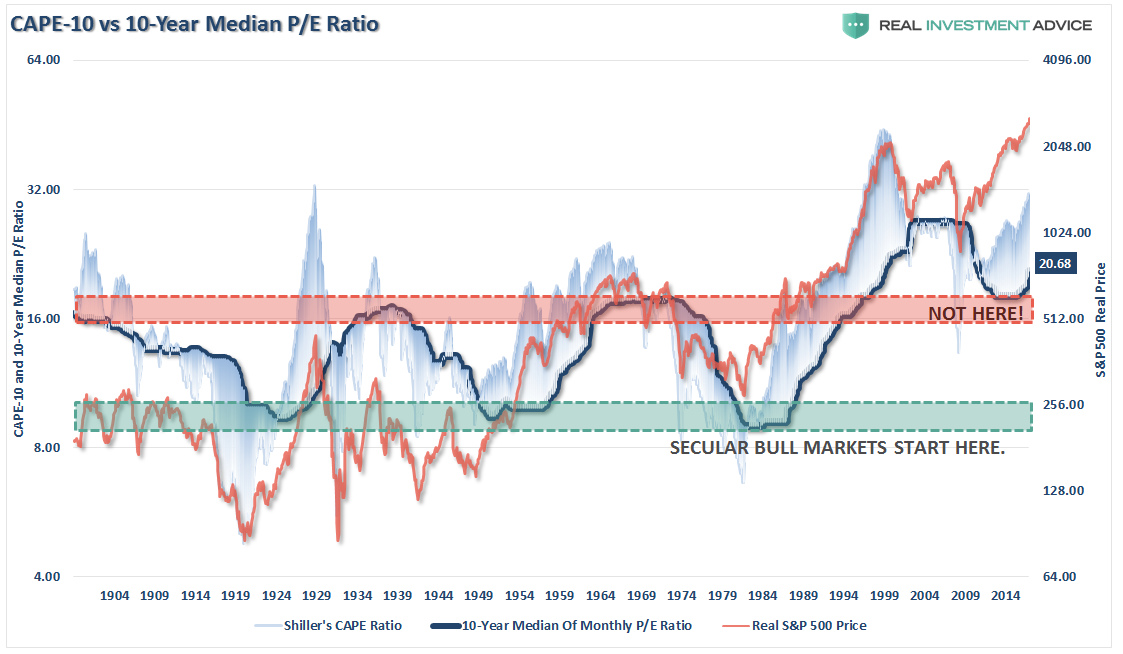
We can see this more clearly by using a 10-year MEDIAN of Shiller’s CAPE ratio. By smoothing out valuation cycles it becomes substantially easier to see that “secular bull markets” have never been born at these levels, but rather died.
Importantly, the drivers behind the long-term secular bull market of the 80’s and 90’s are trends which simply do not exist currently. In the early 80’s and 90’s:
- Inflation and interest rates were high and falling which boosted corporate profitability.
- The extreme negative sentiment of the late 70’s was finally undone by the early 90’s. (At the turn of the century roughly 80% of all individual investors in the market began investing after 1990. 80% of that total started after 1995 due to the investing innovations created by the Internet. The majority of these were “boomers.”)
- Large foreign net inflows to chase the “tech boom” drove prices to extreme levels.
- The mirage of consumer wealth, driven by declining inflation and interest rates and easy access to credit, inflated consumption, corporate profits, and economic growth.
- Corporate profits were boosted by deregulation of industries, wage suppression, outsourcing and productivity increases.
- Pension funding requirements and accounting standards were eased which increased corporate profits.
- Stock-based executive compensation was grossly expanded which led to more “accounting gimmickry” to sustain stock price levels.
The dual panel chart below shows the economic fundamentals versus the S&P 500 and the change that occurred beginning in 1983. (Red dividing line)
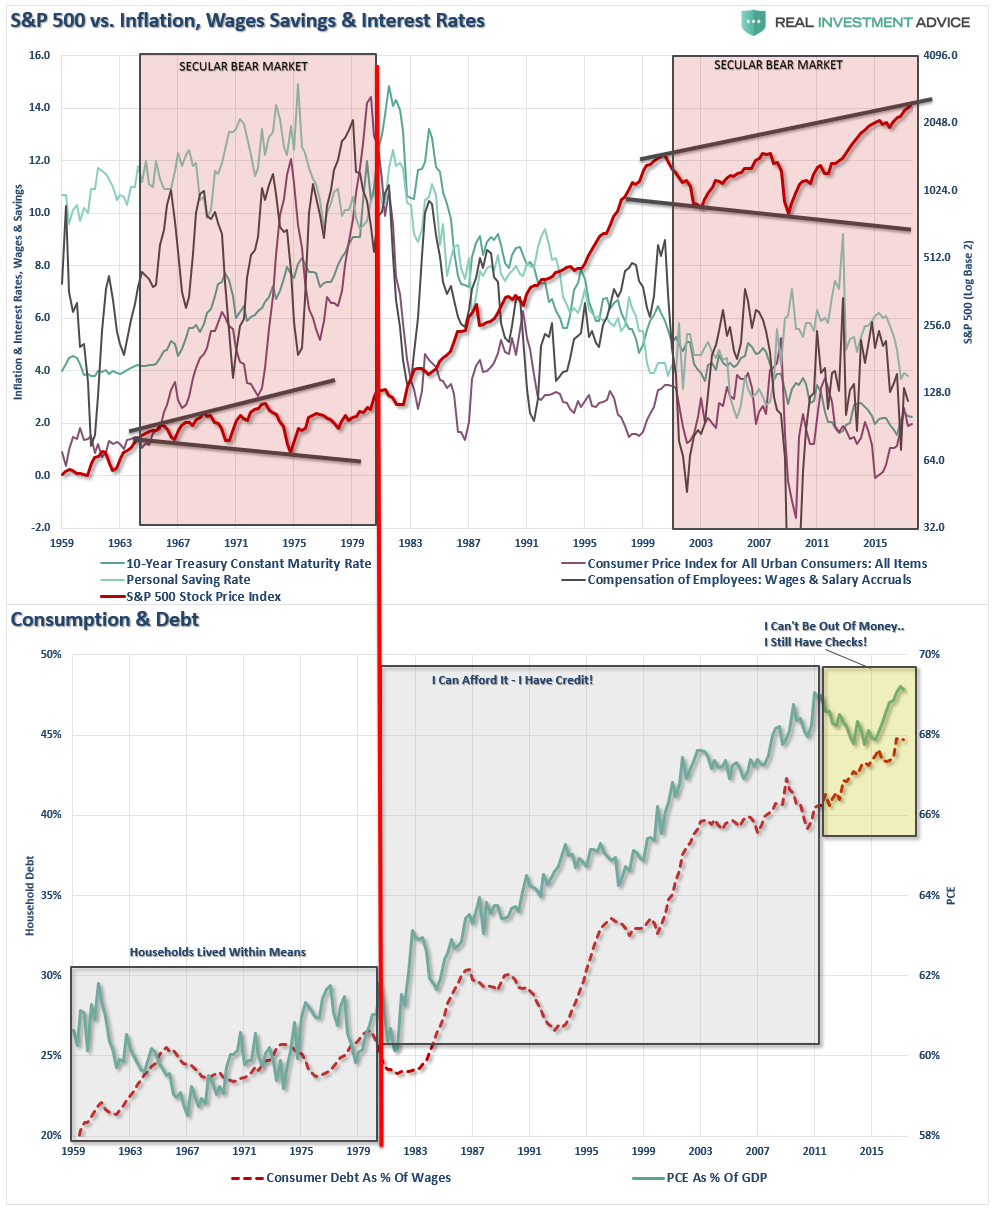
Despite much hope that the current breakout of the markets is the beginning of a new secular “bull” market – the economic and fundamental variables suggest otherwise. Valuations and sentiment are at very elevated levels which are the opposite of what has been seen previously. Interest rates, inflation, wages and savings rates are all at historically low levels which are normally seen at the end of secular bull market periods, not the beginning of one.
Lastly, the consumer, the main driver of the economy, will not be able to again become a significantly larger chunk of the economy. With savings low, income growth weak and debt back at record levels, the fundamental capacity to re-leverage to similar extremes is no longer available.
While stock prices have certainly been driven much higher through the Federal Reserve’s ongoing interventions, that support both in the U.S. and Europe is coming to an end. The inability for the economic variables to “replay the tape” of the 80’s and 90’s, increases the potential of a rather nasty mean reversion at some point in the future. It is precisely that reversion that will likely create the “set up” necessary to start the next great secular bull market. However, as was seen at the bottom of the market in 1974, there were few individual investors left to enjoy the beginning of that ride.
Of course, with the virtual entirety of Wall Street being extremely bullish on the markets and economy going into the end of the year, along with bullish sentiment at extremely high levels, it certainly brings to mind Bob Farrell’s Rule #9 which states:
“When all experts agree – something else is bound to happen.”
