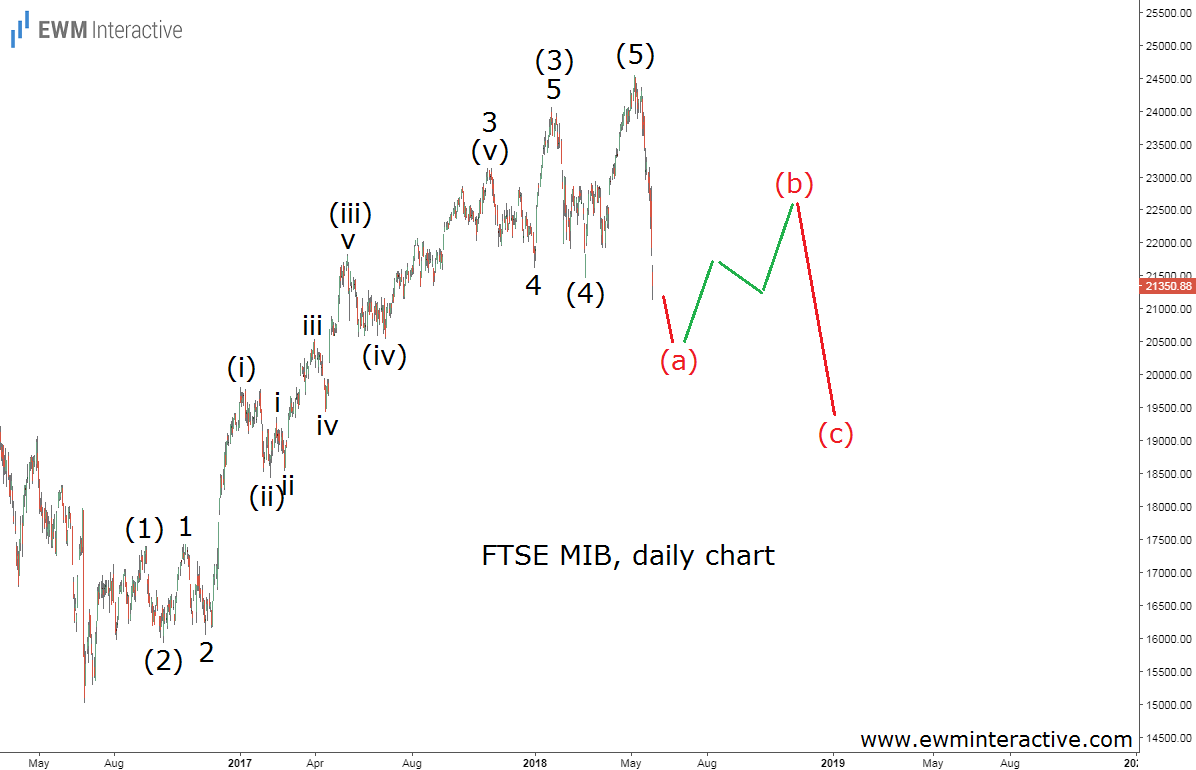
It was a bad month for Italian investors. The country’s benchmark index – FTSE MIB or Milano Indice di Borsa – crashed from its May 7th high of 24 544 to as low as 21 122 yesterday on fears that the fourth largest economy in the European Union is on the brink of a full-blown political crisis. Italy seems to be on its way to a new election after the country’s leading parties failed to form a coalition.
The crash of the Italian stock market could, indeed, be explained with the looming political crisis, but we would like to go one step further and take a look at the situation from an Elliott Wave perspective. As the chart below shows, the stage was set for a plunge even without the coalition talks failure.

The daily chart of FTSE MIB allows us to take a look at the index’ rally from 15 017 in late-June 2016. Its structure forms a textbook five-wave impulse pattern, where four degrees of the trend can be recognized. First, we have the five waves of the pattern, labeled (1)-(2)-(3)-(4)-(5). Then there is the five sub-waves of wave (3), marked as 1-2-3-4-5. Wave 3 of (3) is also subdivided into (i)-(ii)-(iii)-(iv)-(v) and wave (iii) is another impulsive sequence.
According to the theory, every impulse is followed by a three-wave correction in the opposite direction. Therefore it is hardly a surprise that once wave (5) ended the market reversed sharply to the south. Once again, it looks like the market does not follow the news, because it has been anticipating it. After all, it was just two days ago, on Monday, when President Sergio Mattarella concluded the fifth round of fruitless coalition talks and urged the parties to support a caretaker government. The stock market, on the other hand, has been declining for over 20 days now.
And it if this count is correct, it is not done falling, because the plunge from 24 544 does not look like a complete three-wave correction. This means that a small recovery in wave (b) should be expected, before the bears return to drag the FTSE MIB even lower in wave (c). The support area between 19 000 and 20 000 seems to be a reasonable bearish target, suggesting another 1300-2300 points can be lost before the situation starts to improve.
