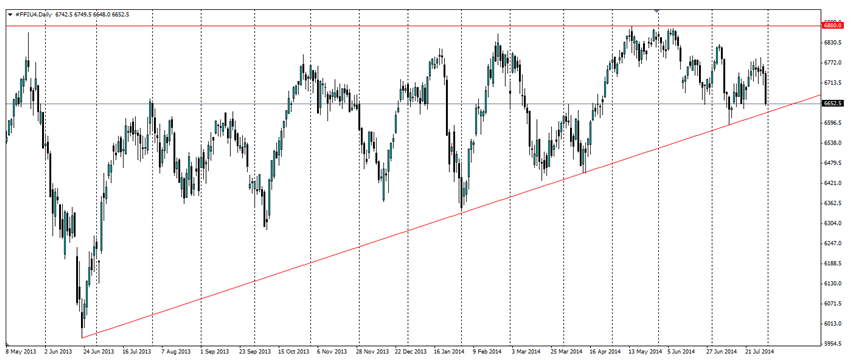
The Equity markets have taken a beating over the last week, but that just makes the main indexes such as the FTSE 100 look like bargains. The FTSE now sits very close to the long term bullish trend line and looks like it will bounce off it.

The news of Argentina defaulting on US$13b of debt sent the main global equity indexes tumbling by around 2% as traders feared this could spread to the wider markets. Further contributing to the selloff was news of an improving US Job market, which led to speculation the US Federal Reserve will begin to talk of raising interest rates, which will make equity yields relatively lower and therefore less attractive.
There will be plenty of attention on the markets tonight as US Nonfarm Payroll data is due to be released at 12:30 GMT. It is expected to be another strong reading at 230k jobs added to the US economy. Anything higher could adversely affect the equity markets for the same reason the market was down yesterday; that the US FED will raise interest rates sooner than expected, reducing the returns for equities.
There is plenty of other news that could affect the FTSE. Manufacturing PMI data for the UK is due at 08:30 GMT. Before the UK data Spain, Italy, France and Germany all release their manufacturing PMI data which will give the market an indication of the health of Europe’s economies.
Looking at technicals, there is one very obviousfeature on the daily chart; that is the bullish trend line that has been in play for over a year as seen on the FTSE 100 D1 chart above. The index has ranged between the bullish trend line and the solid resistance around 6880.0 which has resulted in an upward sloping triangle as the price is squeezed between the two. The sell off yesterday has brought the index down towards the trend line and, if we take history into account, we should see a bounce higher as the market respects this line and bulls come back in.

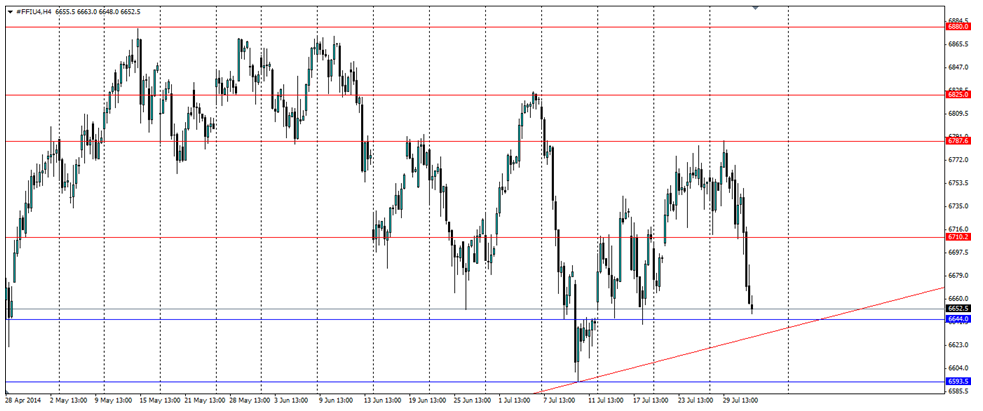
The safest way to get amongst a bounce off the trend line would be to set a stop entry after the price has touched the trend line. That way we will catch the upward momentum and not be dragged lower if panic selling continues and the index breaks out of the pattern. Look for previous levels of support/resistance to act as sticking points for a movement higher. These can be found at 6710.2, 6787.6 and 6825.0 and of course the resistance that forms the top of the shape at 6880.0.
Be wary of market moving news out over the next 24 hours; however if technicals take over this will provide an opportunity for the price to bounce off the trend line.
