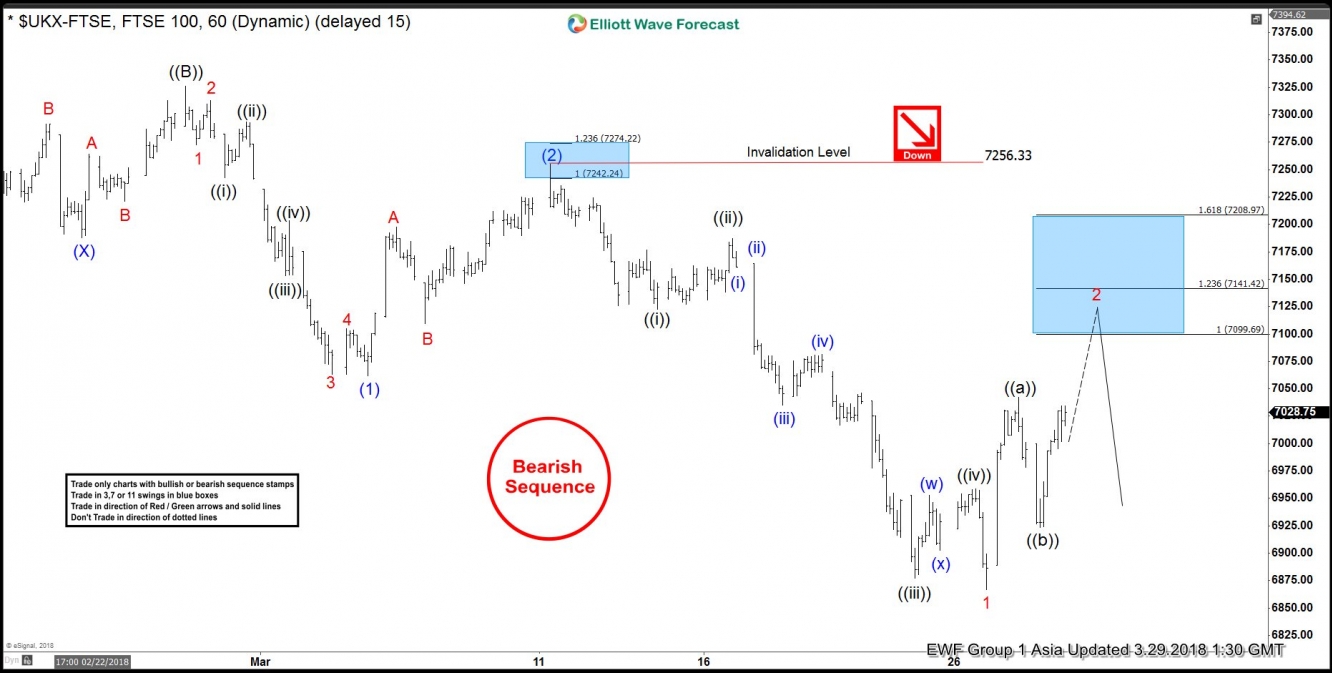
Latest Elliott Wave view in FTSE suggests that the Index ended Primary wave ((B)) at 7326.02 on 2/27/2018 high. From there, Index starts a decline which is unfolding as a 5 waves impulse Elliott Wave structure with an extensionin wave (3). Down from 2/27/2018 high, Intermediate wave (1) ended at 7062.13, Intermediate wave (2) ended at 7256.33, and Intermediate wave (3) is in progress.
In a 5 waves impulse structure, subdivision of wave (1), (3), and (5) are themselves also in 5 waves (impulsive) in the smaller degree. In the case of FTSE, subdivision of Intermediate wave (1) unfolded as 5 waves impulse where Minor wave 1 ended at 7272.87, Minor wave 2 ended at 7312.92, Minor wave 3 ended at 7063.42, Minor wave 4 ended at 7104.66, and Minor wave 5 of (1) ended at 7062.13. Subdivision of Intermediate wave (2) unfolded as a zigzag Elliott Wave structure where Minor wave A ended at 7197.80, Minor wave B ended at 7109.56, and Minor wave C of (2) ended at 7256.33.
Intermediate wave (3) is currently in progress and also subdivided as 5 waves where Minor wave 1 ended at 6866.94. Minor wave 2 bounce is in play to correct cycle from 3/12/2018 high (7256.33) towards 7099.69 – 7208.97 before the decline resumes. While bounces stay below 7256.33 in the first degree, expect sellers to appear at 7099.69 – 7208.97 and bring the Index lower to resume the Intermediate wave (3) decline. We don’t like buying the Index.
FTSE 1 Hour Elliott Wave Chart


