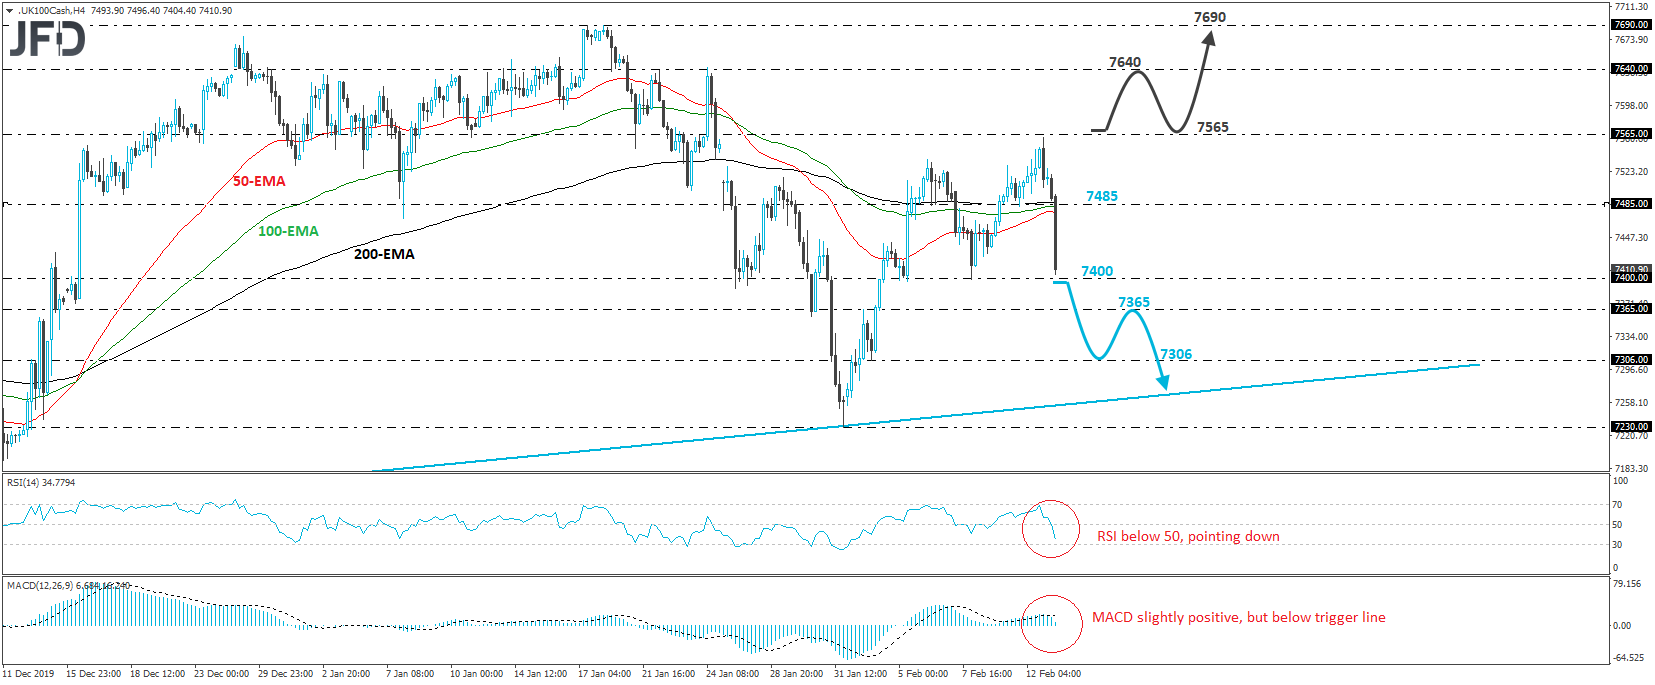
The FTSE 100 cash index fell sharply during the European morning Thursday, breaking below the 7485 support (now turned into resistance) barrier to stop slightly above the key hurdle of 7400. Overall, the index looks to be forming a “non-failure swing top” pattern and thus, despite today’s tumble, we would like to wait for a completion before we get confident on larger declines.
A decisive dip below 7400 is the move that would signal the pattern’s completion and may initially allow declines towards the 7365 territory, marked by the inside swing high of February 3rd. If the bears are not willing to stop there either, then we could see extensions towards the 7306 barrier, defined as a support by an intraday swing low formed on the same day. Another break, below 7306, may target the upside support line drawn from the low of October 3rd.
Shifting attention to our short-term momentum studies, we see that the RSI lies below 50 and points down. It looks to be heading towards 70. The MACD, although slightly positive, lies below its trigger line, pointing south as well. It may obtain a negative sign soon. Both indicators suggest that the index may have the necessary speed to break below the 7400 zone and thereby wake up more bears.
In order to start examining whether the outlook has become brighter, we would like to see a strong recovery above the 7565 level, which is fractionally above the peak of February 12th. Such a move would confirm a forthcoming higher high on both the 4-hour and daily charts and may encourage the bulls to march higher, towards the 7640 zone, which is marked by the peak of January 22nd and lies fractionally below the high of January 24th. If they prove strong enough to breach that hurdle as well, then we may see them putting the 7690 area on their radars, which provided strong resistance on January 17th and 20th.

