Before the sell-off from Trump Turmoil, there was the sell-off ahead of the Easter weekend that looked weighty enough to deliver an extended breakdown below the 50-day moving average (DMA) for the S&P 500 (via SPDR S&P 500 (NYSE:SPY)). Buyers came storming back after that weekend. Out of curiosity, I used SwingTradeBot.com to identify the strongest stocks of the period as defined by stocks which hit new 52-week highs both the previous time the S&P 500 (SPY) hit an all-time high and the day after that April breakdown.
I was quite surprised to find the list dominated by utilities, REITs, and homebuilders. I narrowed that list down to four stocks that looked most attractive as a buy on the next market sell-off: in order of descending interest: IHS Markit Ltd (NASDAQ:INFO), Interxion Holding NV (NYSE:INXN), ILG Inc (NASDAQ:ILG), and Energizer Holdings Inc (NYSE:ENR).
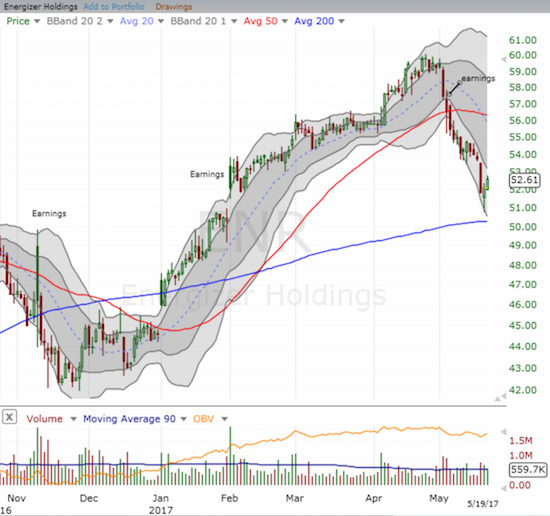
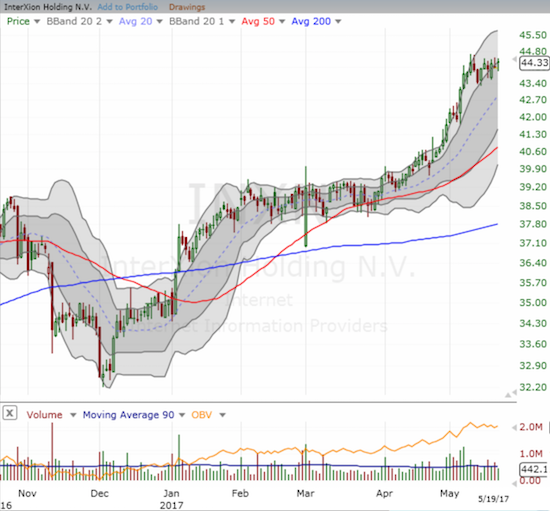
My surprise increased in the aftermath of last week’s sell-off. ENR was the ONLY stock of these four to dip during that sell-off, and ENR was already in the middle of an earnings related pullback. INFO dipped slightly and then ended the week at ANOTHER 52-week high. INXN traded UP during Wednesday’s sell-off and finished the week at a new (marginal) 52-week high. ILG also ended the week at a new 52-week high with a Wednesday pullback that is barely perceptible in the middle of a strong and persistent uptrend. Here are the stock charts…
Energizer Holdings, Inc. (ENR) experienced a severe 50DMA breakdown following its latest earnings report. Last week, ENR reversed all the gains following February’s report. The uptrending 200DMA MAY have provided approximate support, but ENR is still trapped inside a downard trending channel formed by its lower Bollinger Bands (BBs).
Interxion Holding N.V. (INXN) completely ignored last week’s turmoil. It looks poised for a fresh breakout.
IHS Markit Ltd (INFO) is as bullish as ever with a fresh breakout to a 52-week high.
ILG, Inc (ILG) is still sprinting ever higher with barely a pause to recognize last week’s turmoil.
Source: FreeStockCharts.com
So while I did not buy any of these stocks during last week’s sudden one-day dip, I am VERY encouraged to see some confirmation of the effectiveness of SwingTradeBot scans. Using SwingTradeBot I quickly and easily identified candidate stocks based on custom conditions, and these stocks collectively have so far exhibited enduring characteristics.
Going forward my plan for these stocks is as follows:
- ENR: No rush at this point. Willing to wait for a close above its 50DMA.
- INFO: Will buy the fresh breakout with a small (1/3) position as a long-term position.
- INXN: Will “stop into” a fresh breakout with a small position. Otherwise, I will continue waiting for a dip. (Last earnings report was on May 3).
- ILG: This looks like a momentum stock that I simply missed. I will keep waiting for a dip. (Last earnings report was on May 4).
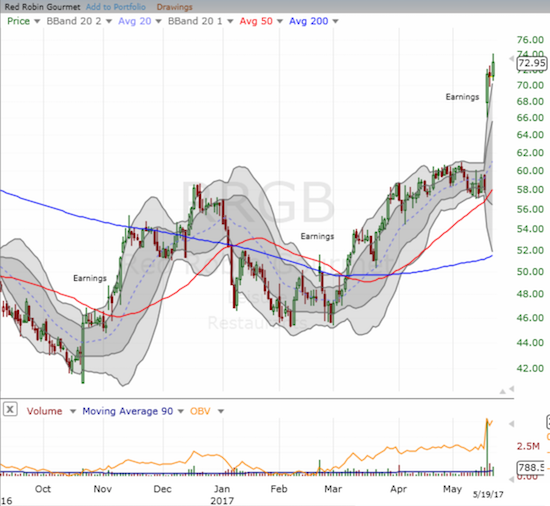
So what about stocks that displayed strength in the face of last Wednesday’s sell-off? SwingTradeBot generates 32 A-rated stocks which hit all-time highs that day. At the top of this list is Red Robin Gourmet Burgers Inc (NASDAQ:RRGB). I have been spying RRGB for a while, but I was taken completely aback by Wednesday’s huge post-earnings gap up. I made a play on the first dip of the move and felt fortunate take a few points of profit later in the day. I wish I held onto it. I think this move is exaggerated by the large short interest: a whopping 24.7% of the float.
Red Robin Gourmet Burgers (RRGB) soared 23% post-earnings and still has more gas left in the tank.
Be careful out there!
Full disclosure: no positions


