Investing.com’s stocks of the week
The historical action of the precious metals sector over the past few weeks has continued.
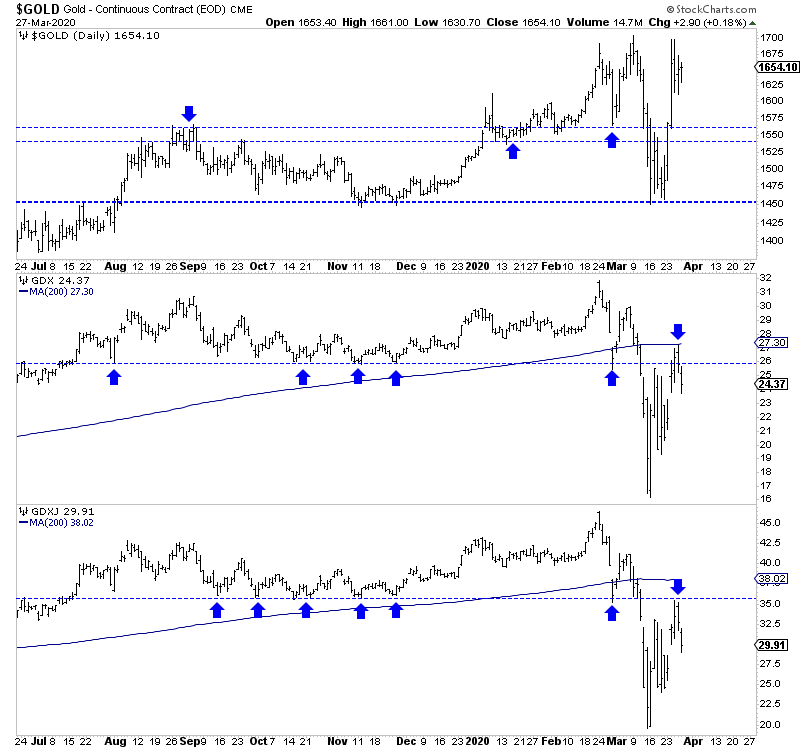
The strong recovery in (NYSE:GDX), (NYSE:GDXJ) and Silver has potentially invalidated the technical breakdown that occurred during the crash. It appears to be a failed breakdown.
Furthermore, Gold was looking vulnerable on the weekly, and monthly chart yet was able to slingshot back to $1700/oz. It is currently up $88/oz or 5.6% this month, while the S&P 500 is down 14%.
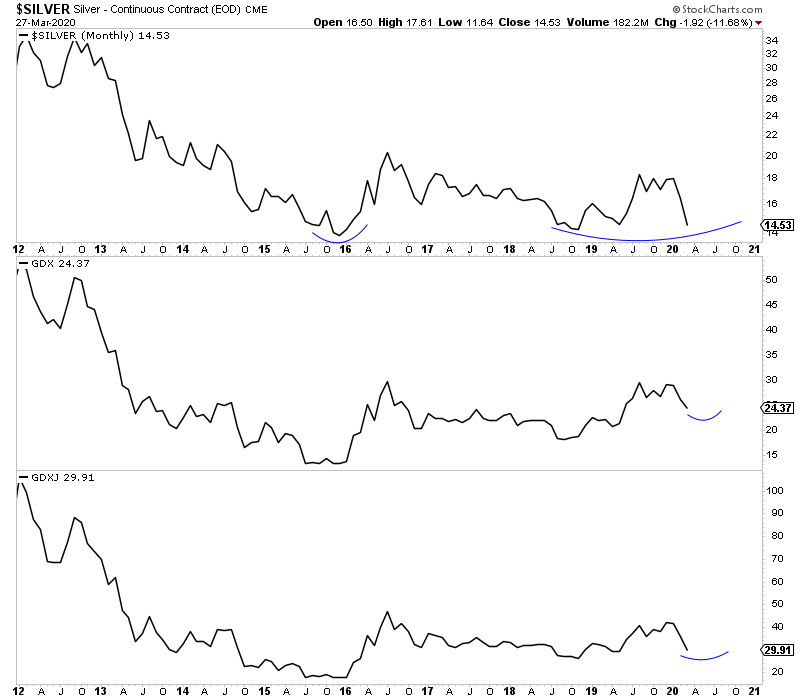
The market provides and conveys information day to day and week by week. Still, monthly charts will smooth out the volatility, and that is especially important during periods of extreme volatility.
We plot the monthly line charts for Silver, GDX, and GDXJ below.


There are two trading days left in March, but note how these charts look entirely different from just a week ago. Silver has not broken down to a new low, nor have the miners (GDX, GDXJ), which are merely
correcting.
