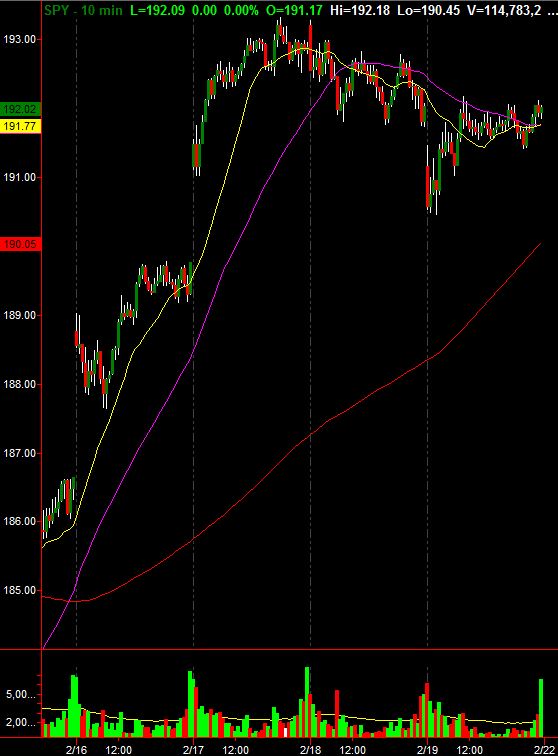
The markets closed flat on options expiration Friday. In the last week the S&P 500 gained over 100 points through Wednesday, and paused on Thursday and Friday. This pattern is known as bullish consolidation. As long as this pattern formation holds, markets are likely to head higher in the near term. The initial resistance will be the S&P high from February 1st, 2016 which was around 1950. That is approximately 30 points higher from here. It is also right around the daily 50 moving average. Based on the chart formation, it is possible the S&P hits this level by early to mid next week. Once there, a major battle will ensue...bulls vs. bears.
Oil ended the week slightly higher, but very choppy. Oil appears to have turned a corner in terms of being out of freefall. Early in the week Russia and Saudi Arabia agreed to keep production from exceeding current levels. While it has nothing to do with cutting production, it does show that two major oil producers are willing to work together. In a way, it puts a floor on oil in the $25/bbl range. This is making the shorts nervous. Based on the charts, oil is likely to move higher in the near term.
While minor short term upside still remains, the longer term trend of the market still down. I expect a move as low as 1600 on the S&P by March/April 2016. The below chart shows the week for the N:SPY, the S&P 500 tracking ETF.

