Upcoming US Events for Today:
- Motor Vehicle Sales for July will be released throughout the day. Total Vehicle Sales for is expected to decline to 16.7M versus 17.0M previous.
- Employment Situation Report for July will be released at 8:30am. The market expects Non-Farm Payrolls to increase by 233,000 versus 288,000 previous. Private Payrolls is expected to increase by 233,000 versus 262,000 previous. The Unemployment Rate is expected to remain steady at 6.1%.
- Personal Income and Spending for June will be released at 8:30am. The market expects Personal Income to show a month-over-month increase of 0.4%, consistent with the previous report. Consumer Spending is expected to show a month-over-month increase of 0.4% versus an increase of 0.2% previous.
- PMI Manufacturing Index for July will be released at 9:45am. The market expects 56.0 versus 57.3 previous.
- Consumer Sentiment for July will be released at 9:55am. The market expects 81.5 versus 81.3 previous.
- ISM Manufacturing Index for July will be released at 10:00am. The market expects 56.0 versus 55.3 previous.
- Construction Spending for June will be released at 10:00am. The market expects a month-over-month increase of 0.5% versus an increase of 0.1% previous.
Upcoming International Events for Today:
- German Manufacturing PMI for July will be released at 3:55am EST. The market expects 52.9 versus 52.0 previous.
- Euro-Zone Manufacturing PMI for July will be released at 4:00am EST. The market expects 51.9 versus 51.8 previous.
- Great Britain Manufacturing PMI for July will be released at 4:30am EST. The market expects 57.1 versus 57.5 previous.
The Markets
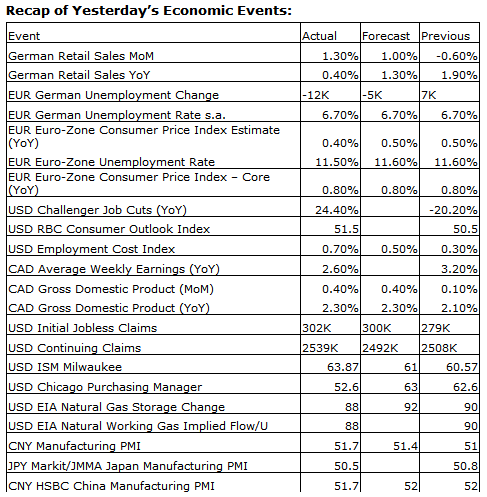
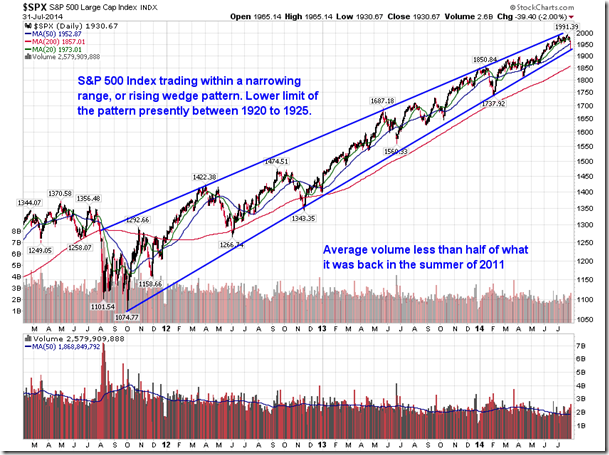
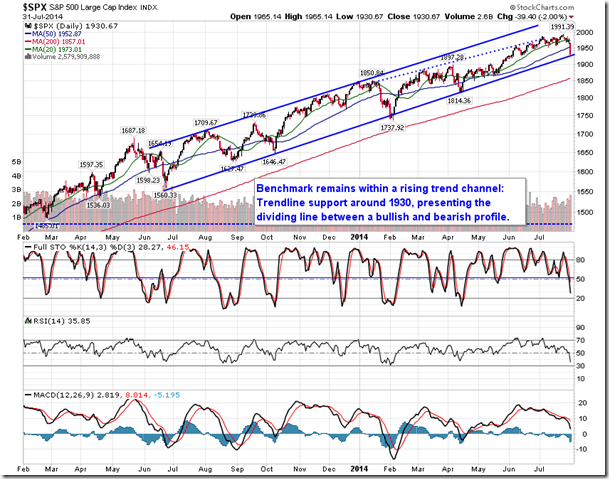
Stocks plunged on Thursday with a number of factors influencing the trade during the session. In the US, Chicago Manufacturing PMI fell by 10 points to 52.6, the largest decline since October of 2008, contradicting recent indications of manufacturing released throughout the course of July. Then in Argentina, the country defaulted on its debt for the second time in 12 years. While over in the Euro-Zone, the Consumer Price Index, a gauge of inflation, resumed its downward path, showing a year-over-year increase of a mere 0.4% and reigniting concerns of deflation. Each of these factors, combined with ongoing concerns pertaining to rising geopolitical tensions and the looming rate increase from the US Fed, acted as a perfect storm for a washout session, which saw investors book profits following the recent run-up in stocks. The S&P 500 Index and Dow 30 both closed below the important 50-day moving average level, while the Nasdaq found support at this intermediate level. The S&P 500 Index is currently testing the lower limit of the rising trend channel that stretches back to this time last year; this lower trendline, now around 1930, remains the dividing line between a bullish and bearish profile for the large-cap benchmark.
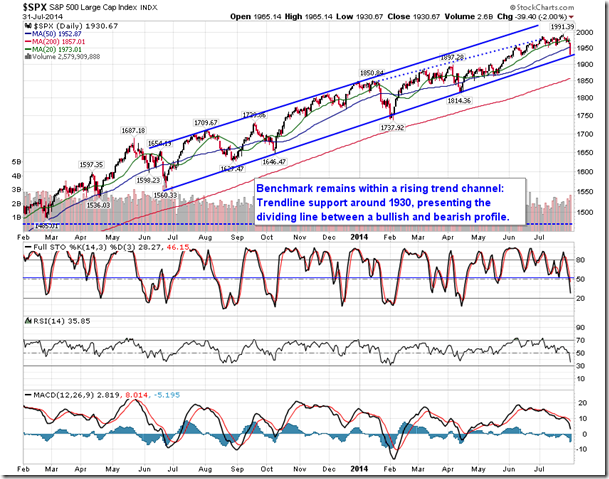
During my appearance on BNN’s Market Call yesterday, I presented a chart of the S&P 500 that showed a potentially bearish setup. The chart has been updated below to reflect yesterday’s activity. The benchmark has been pushing higher within a rising wedge pattern since the Summer of 2011, just as QE2 was winding down. The narrowing range implies that the strength of the bull market that has persisted over the past three years is waning as the rallies become less intense. Bearish confirmation is provided upon a break below the lower limit of the pattern, currently hovering between 1920 to 1925, similar to the lower limit of the rising trend channel presented above. The pattern has been accompanied by declining volume as investor enthusiasm towards the bull market trend wanes; the 50-day moving average volume for the S&P 500 currently sits at 1.8 Billion, less than half of the 4 Billion share average during the summer of 2011. A break below the lower limit of the pattern would likely coincide with the long-awaited 10%+ correction in equity prices, a healthy retracement that would renew upside momentum and provide appealing buying opportunities down the road.
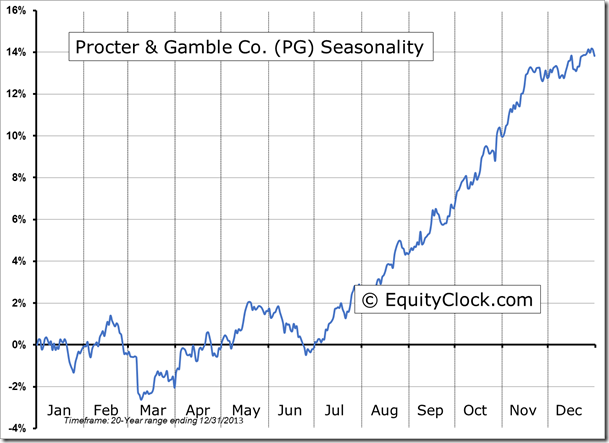
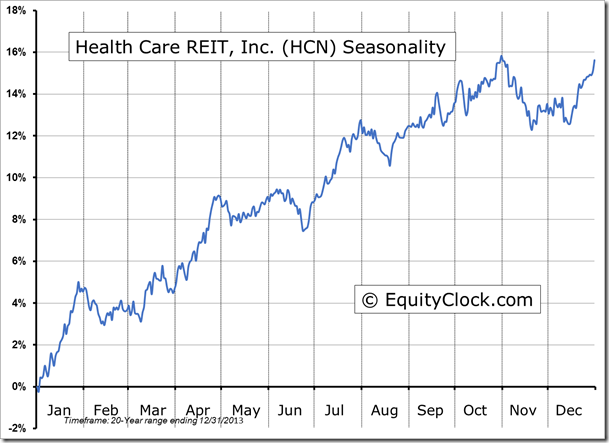
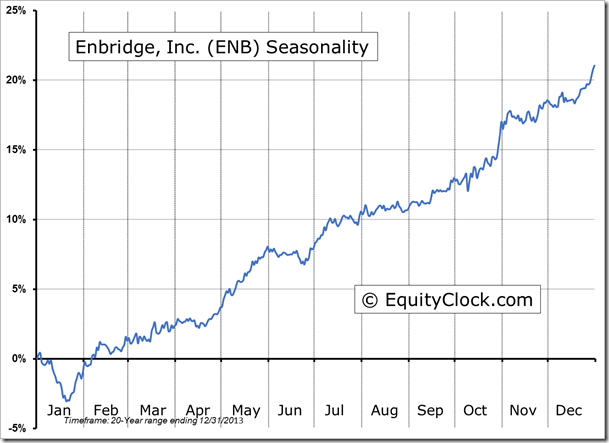
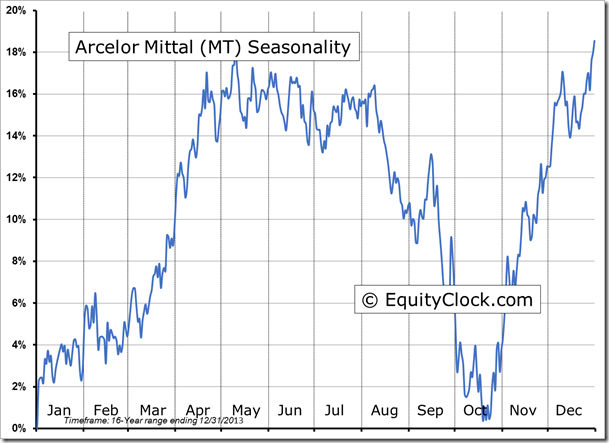
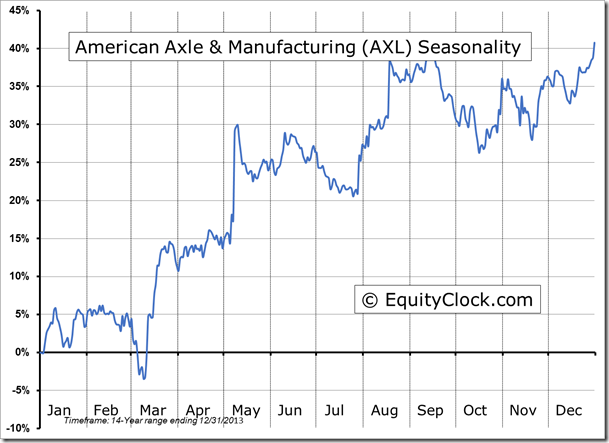
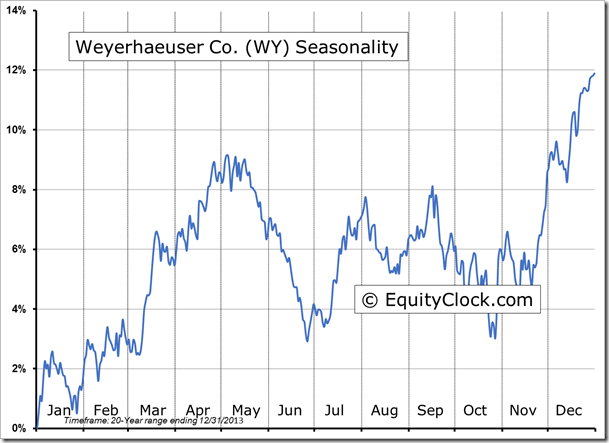
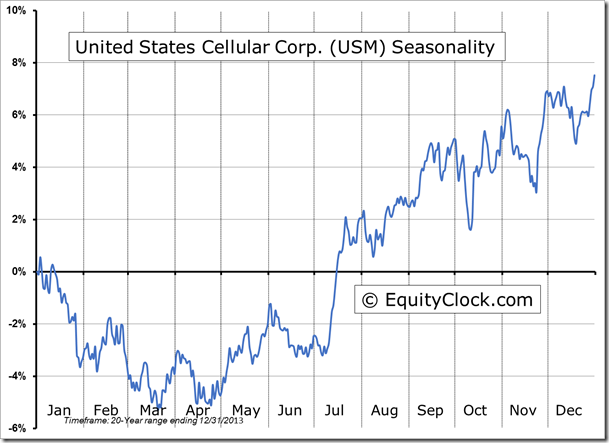
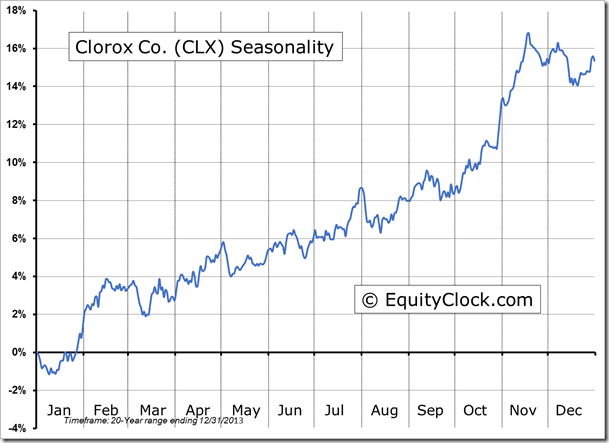
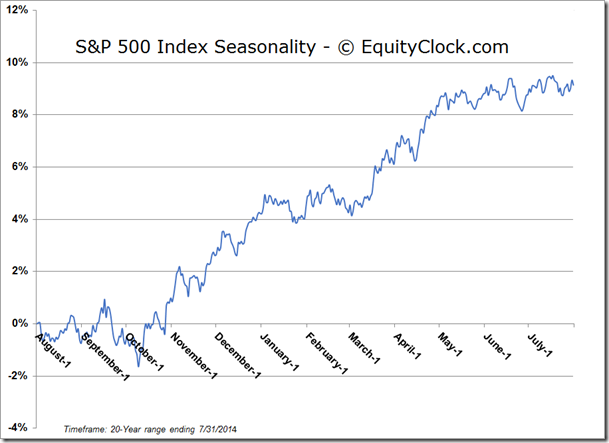
Seasonal charts of companies reporting earnings today:
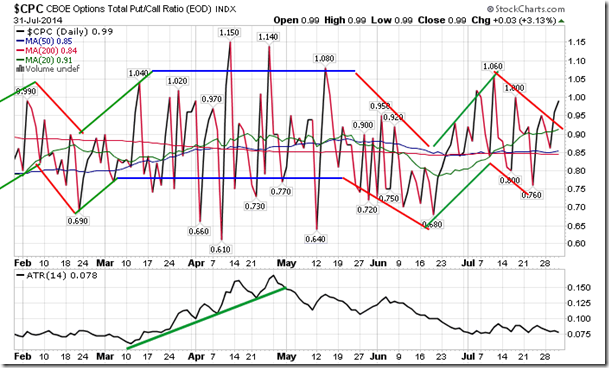
Sentiment on Thursday, as gauged by the put-call ratio, ended around neutral at 0.99.
S&P 500 Index
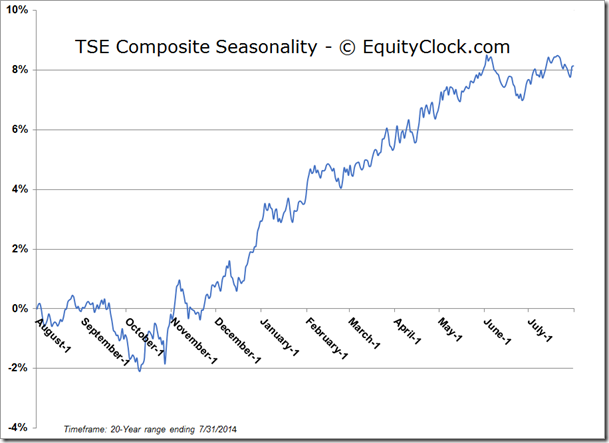
TSE Composite
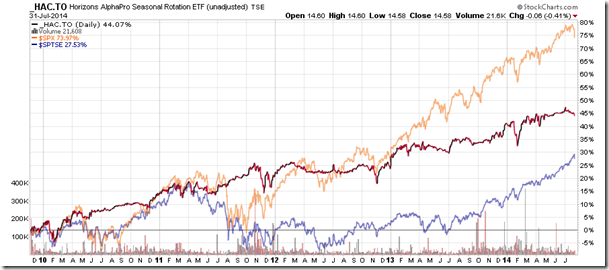
Horizons Seasonal Rotation ETF (TO:HAC)
- Closing Market Value: $14.58 (down 0.41%)
- Closing NAV/Unit: $14.56 (down 0.53%)
Performance*
| 2014 Year-to-Date | Since Inception (Nov 19, 2009) | |
| HAC.TO | 1.82% | 45.6% |
* performance calculated on Closing NAV/Unit as provided by custodian
