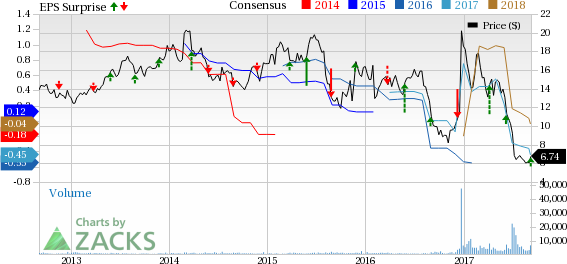
Shares of Fred’s Inc. (NASDAQ:FRED) , also known as Fred’s Pharmacy soared around 17% yesterday following narrower-than-expected loss reported in second-quarter fiscal 2017. Sales were also in line with the Zacks Consensus Estimate. Notably, the quarter witnessed the bottom-line improvement in comparison with the prior-year period for the first time over a year. We believe the turnaround initiatives have aided the company to report moderate decline in comparable-store sales (comps).
Q2 Highlights
The discount retailer witnessed adjusted quarterly loss of 15 cents per share, which was narrower than both the Zacks Consensus Estimate loss and prior-year loss of 18 cents. This was on the back of comps improvement and expansion in gross margins.
Including non-recurring and asset impairment costs, quarterly loss came in at 78 cents per share.
Quarterly net sales declined 4.1% year over year to $507.8 million but were almost in line with the Zacks Consensus Estimate of $507 million. The downturn was mainly due to the closure of 39 underperforming outlets in the previous quarter.
Comps slipped 0.3% in the quarter, hurt by the persistent rise in generic dispensing rate, coupled with a 0.8% effect from the sale of low productive discontinued inventory in comparison with the year-ago period. However, the decline was narrower than a 2% dip witnessed in the year-ago period. Excluding the discontinued inventory effect, total comps represented positive growth in the quarter.
While the company’s gross profit dropped 1.7% year over year to $126 million in the quarter, gross margin expanded 60 basis points to 24.8%. The uptick was driven by gains from its turnaround plan. However, Fred’s adjusted operating loss came in at $28.1 million in the quarter, wider than the year-ago period’s loss of $10.9 million.
Meanwhile, the company continues to witness improvement in Retail Pharmacy, delivering flat comp script on a year-to-date basis. Also, growth has been seen in its generic dispensing rate along with gross profit dollar per script on the whole.
Also, in its Specialty Pharmacy business, management successfully delivered momentum driven by turnaround strategies, solid sales growth backed by geographic expansion and diversification with the existing therapies.
Markedly, the company has installed a new operating system in the Memphis specialty facility, which is likely to be completed by November. This implementation will aid the company to maintain its retail and specialty businesses with the same operating system. Going forward, it is likely to provide a single view of the patients, facilitating the treatments and therapies in both businesses.
In the Front Store operations, management witnessed improvement in the key edibles categories in comparison with the last year, in spite of food deflation in consumables as well as continuing market headwinds.
Financial Update
Fred’s ended the fiscal second quarter with cash and cash equivalents of $5.7 million, long-term portion of indebtedness of $138.7 million and shareholders' equity of $270.7 million.
Store Update
As of Jul 29, 2017, Fred’s operates 600 pharmacy and general merchandise stores. This includes 14 franchised Fred’s Pharmacy locations along with three additional specialty pharmacy-only locations.
Stock Performance
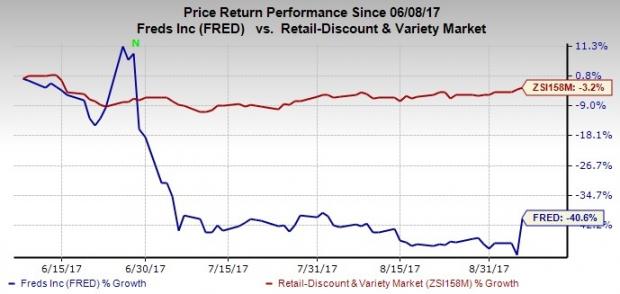
We note that this Zacks Rank #4 (Sell) stock has plunged over 40% in the last three months, wider than the industry’s decline of 3.2%. This underperformance can be attributable to the company’s dismal comps performance since past many quarters along with headwinds in the consumable categories. Nevertheless, we believe the strategic initiatives might help the company to turnaround, going ahead.

Looking Ahead
We note that Fred’s remains committed to the successful execution of its turnaround strategy, which is likely to mainly focus on reducing selling, general and administrative (SG&A) expenses and driving free cash flow and overall profitability.
Additionally, the company is prioritizing the areas with a competitive gain and those where improvement is required. In fact, the company has made leadership changes and is committed to enhance its shareholders’ value as well.
Furthermore, its Retail and Specialty Pharmacy businesses are improving significantly, and the momentum is likely to continue throughout fiscal 2017.
Three Retail Stocks in the Limelight
Better-ranked stocks in the broader sector are Aaron's, Inc. (NYSE:AAN) , The Children's Place, Inc. (NASDAQ:PLCE) and Sally Beauty Holdings, Inc. (NYSE:SBH) .
Aaron's earnings have outpaced the Zacks Consensus Estimate in each of the trailing four quarters with an average positive surprise of 14%. Currently, the stock sports a Zacks Rank #1 (Strong Buy). You can see the complete list of today’s Zacks #1 Rank stocks here.
Children's Place, a Zacks Rank #1 stock, has a long-term earnings growth rate of 9%. Also, the company delivered positive earnings surprise of 16.3% in the last four quarters.
Sally Beauty has a long-term earnings growth rate of 5.6% and carries a Zacks Rank #2 (Buy). Also, its earnings have surpassed the Zacks Consensus Estimate by 6.1% in the last quarter.
One Simple Trading Idea
Since 1988, the Zacks system has more than doubled the S&P 500 with an average gain of +25% per year. With compounding, rebalancing, and exclusive of fees, it can turn thousands into millions of dollars.
This proven stock-picking system is grounded on a single big idea that can be fortune shaping and life changing. You can apply it to your portfolio starting today.
Learn more >>
Aaron's, Inc. (AAN): Free Stock Analysis Report
Children's Place, Inc. (The) (PLCE): Free Stock Analysis Report
Fred's, Inc. (FRED): Free Stock Analysis Report
Sally Beauty Holdings, Inc. (SBH): Free Stock Analysis Report
Original post

