
Franklin Resources (NYSE:BEN) has announced preliminary assets under management (AUM) by its subsidiaries of $714.2 billion for February 2019. Results display 5.3% growth from the $678.3 billion recorded as of Jan 31, 2019. Net market gains, along with the Benefit Street Partners L.L.C. acquisition, partially offset by net outflows, led to this upside. However, the figure dipped 4.1% from the previous year.
Month-end total equity assets came in at $287 billion, up 2.1% from the previous month, but down 9.5% year over year. Of the total equity assets, around 62% were from international sources, while the remaining 38% came in from the United States.
Total fixed income assets were $284 billion, up 10.9% from January and 1.1% from the prior year. Overall, tax-free assets accounted for only 22% of the fixed-income assets, while the remaining 78% was taxable.
Franklin recorded $133.6 billion in hybrid assets, which was up 1.8% from $131.2 billion witnessed in the previous month, but down 4.6% from $140.1 billion reported in February 2018.
Cash management funds came in at $9.6 billion, down from the prior-month figure of $9.7 billion, but up from the year-ago tally of $6.8 billion.
The company’s global footprint is an exceptionally favorable strategic point as its AUM is well diversified. Nevertheless, regulatory restrictions and sluggish economic recovery might mar AUM growth, and escalate costs.
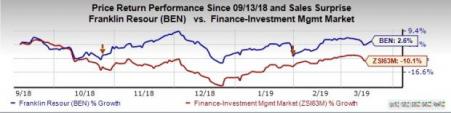
Currently, Franklin carries a Zacks Rank #3 (Hold). Shares of the company have gained around 2.6% over the last six months, as against the 10.1% decline recorded by the industry.
You can see the complete list of today’s Zacks #1 Rank (Strong Buy) stocks here.
Among other asset managers, Invesco Ltd.’s (NYSE:IVZ) AUM as of Feb 28, 2019, came in at $945.7 billion, up nearly 1.6% from the previous month. Favorable market returns, higher money market AUM and reinvested distributions were the key factors driving growth in its total AUM. Moreover, foreign exchange boosted the month’s AUM by $0.2 billion. However, these were partially muted by net long-term outflows and non-management fee earning AUM outflows.
Further, T. Rowe Price Group, Inc. (NASDAQ:TROW) and Legg Mason Inc. (NYSE:LM) are expected to release preliminary AUM results for February, later this week.
Today's Best Stocks from Zacks
Would you like to see the updated picks from our best market-beating strategies? From 2017 through 2018, while the S&P 500 gained +15.8%, five of our screens returned +38.0%, +61.3%, +61.6%, +68.1%, and +98.3%.
This outperformance has not just been a recent phenomenon. From 2000 – 2018, while the S&P averaged +4.8% per year, our top strategies averaged up to +56.2% per year.
See their latest picks free >>
Legg Mason, Inc. (LM): Free Stock Analysis Report
Franklin Resources, Inc. (BEN): Free Stock Analysis Report
T. Rowe Price Group, Inc. (TROW): Free Stock Analysis Report
Invesco Ltd. (IVZ): Free Stock Analysis Report
Original post