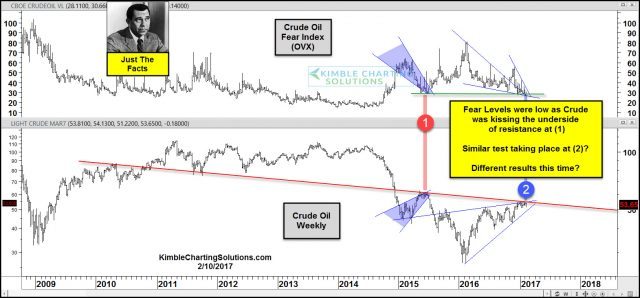
Take a look at crude oil and its 'fear index' (OVX) since 2009.

Crude's one-year trend is up, following lows near $30 per barrel around this time last year. Its longer-term trend is lower, as it has created a series of lower highs and lower lows since 2010. At this point, crude is trying to change its long-term trend.
In 2015, oil hit the underside of falling resistance, on low fear levels at (1). What followed was a decline in crude and a rally in fear. Currently, crude finds itself testing the underside of falling resistance as fear levels have declined, back to the lows hit back in 2015.
Crude oil and the S&P 500 DO NOT always correlate. Over the past couple of years, for some reason, correlation between the two has been higher than normal. If the two-year correlation trend continues, this price point might be important to both oil and the broad markets.
With Fear levels low and crude testing falling resistance, bullish oil traders have to see crude breakout and fear levels break down.
