🐂 Not all bull runs are created equal. November’s AI picks include 5 stocks up +20% eachUnlock Stocks

Understanding The Market- The Four Deuces Scenario

Published 08/09/2017, 12:11 AM
Updated 07/09/2023, 06:31 AM
US500
-

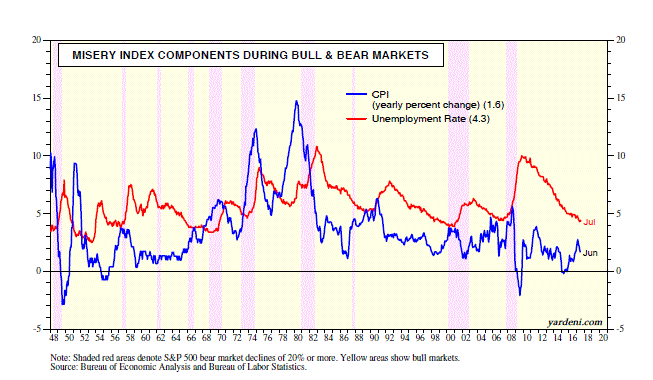
Mesery Index Components During Bull & Bear Markets


While real GDP growth continues to amble along at a leisurely pace of 2.0% y/y, the labor market is sprinting at a fast pace. In the 7/31 Morning Briefing, I described my 2-2-2 economic scenario, with real GDP continuing to grow around 2.0% y/y, inflation remaining at or slightly below 2.0%, and the federal funds rate peaking late next year at 2.00%.

One of my accounts suggested the Four Deuces (2-2-2-2) scenario, adding the unemployment rate to the Three Deuces scenario. The jobless rate was 4.3% during July and could fall to 2.0%, which would be the lowest on record starting in January 1948. The low for this series was 2.5% during April and May 1953. A new record low, even at 2.0%, is conceivable if the Three Deuces scenario, continues to play out. That’s because having slow economic growth with subdued inflation and low interest rates increases the odds of a very long economic expansion, with the labor market continuing to tighten.

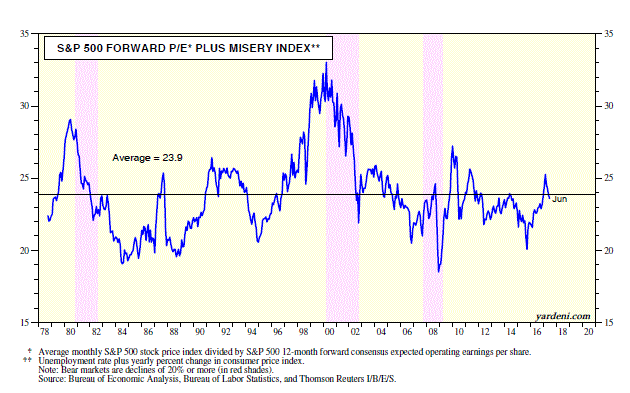
That would be ideal for my “long good-buy” scenario for the stock market, since bull markets usually don’t end until the unemployment rate falls to its cyclical trough and starts moving higher. The stock market also does well when the Misery Index, which is the sum of the unemployment rate and the inflation rate, is falling. Indeed, there is an inverse correlation between the Misery Index and the S&P 500 P/E since 1979. Consider the following:

(1) The sum of the forward P/E and the Misery Index has averaged 23.9 since 1979. It was 23.6 during June, suggesting that the stock market is fairly valued.

(2) A lower Misery Index, as a result of a further decline in the unemployment rate, would leave more room for P/E expansion without irrational exuberance. If the unemployment rate drops from 4.3% to 2.0% and the inflation rate remains at 2.0%, that would lower the Misery Index, leaving room for a reasonable increase in the forward P/E from 17.8 currently to 19.9 (since 19.9 + 4.0 = 23.9, which is the average of the Misery Index since 1979).

S&P 500 Forward P/E Plus Misery Index

Latest comments

Loading next article…
Risk Disclosure: Trading in financial instruments and/or cryptocurrencies involves high risks including the risk of losing some, or all, of your investment amount, and may not be suitable for all investors. Prices of cryptocurrencies are extremely volatile and may be affected by external factors such as financial, regulatory or political events. Trading on margin increases the financial risks.
Before deciding to trade in financial instrument or cryptocurrencies you should be fully informed of the risks and costs associated with trading the financial markets, carefully consider your investment objectives, level of experience, and risk appetite, and seek professional advice where needed.
Fusion Media would like to remind you that the data contained in this website is not necessarily real-time nor accurate. The data and prices on the website are not necessarily provided by any market or exchange, but may be provided by market makers, and so prices may not be accurate and may differ from the actual price at any given market, meaning prices are indicative and not appropriate for trading purposes. Fusion Media and any provider of the data contained in this website will not accept liability for any loss or damage as a result of your trading, or your reliance on the information contained within this website.
It is prohibited to use, store, reproduce, display, modify, transmit or distribute the data contained in this website without the explicit prior written permission of Fusion Media and/or the data provider. All intellectual property rights are reserved by the providers and/or the exchange providing the data contained in this website.
Fusion Media may be compensated by the advertisers that appear on the website, based on your interaction with the advertisements or advertisers.
© 2007-2024 - Fusion Media Limited. All Rights Reserved.