In my last posts on the euro (NYSE:FXE), the Canadian dollar (NYSE:FXC), and the British pound (NYSE:FXB), I noted significant trading moves by speculators in foreign exchange as reported by the CFTC’s Commitments of Traders (CoT). The latest CFTC CoT report shows more of the same for these currencies but the backdrops may be shifting under the feet of speculators.
Euro
The euro had a rough week. Although it began with speculators further reducing net short positions from 19,662 to 7,923, the euro sold off broadly against major currencies. Net shorts have not been this low since May 12, 2014 when speculators finally brought an end to a 9-month period dominated by euro bullishness. As I noted in my previous post on the euro, I am still assuming speculators are making a major change in positioning that will sustain itself. So, for now, I am taking last week’s weakness as a gift starting point for euro-positive positions.
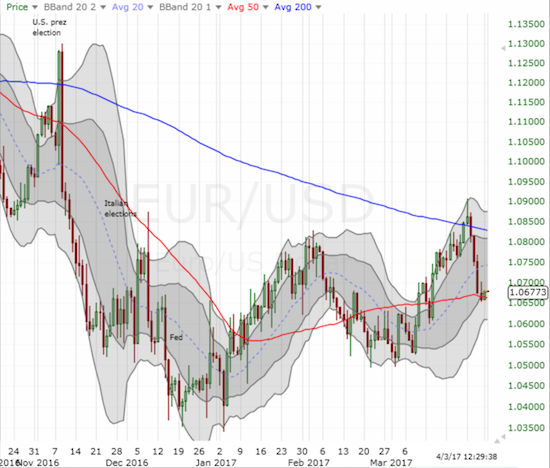
After a sharp rejection at 200DMA resistance, the euro is struggling to hold 50DMA support against the U.S. dollar (EUR/USD).
Canadian dollar
On March 20th, speculators abruptly switched from notable net bulls to notable net bears on the Canadian dollar. In the latest CFTC data, speculators increased net shorts slightly. Speculators were last this bearish on the Canadian dollar about a year ago. Over the past week, two developments ran counter to the sudden bearishness of speculators: oil and GDP.
Oil prices surged last week. The move was enough to deliver a 5.5% gain to United States Oil (NYSE:USO) for the week.
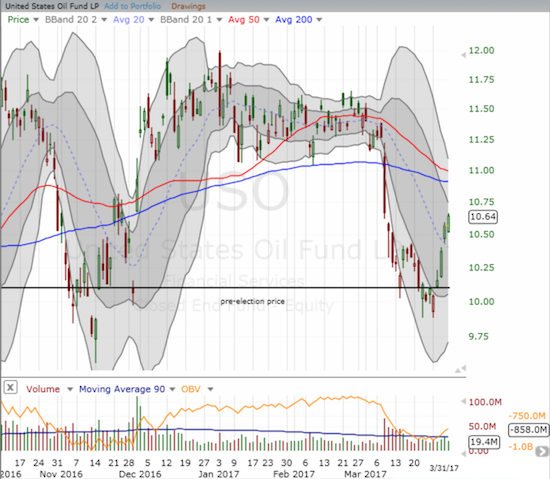
United States Oil (USO) has bounced sharply from its complete reversal of post-election gains.
On the 31st of March, Statistics Canada reported relatively strong GDP numbers for the month of January. Here are some highlights:
- Goods-producing industries grew 1.1% month-over-month, the seventh monthly gain in the last eight months.
- Service-producing industries grew 0.4% month-over-month, the highest monthly gain since June, 2015.
- Manufacturing has grown every month since June, 2016 excluding October.
- Wholesale trade grew 2.4% month-over-month, the highest monthly gain since July, 2013.
- Retail trade grew 1.5% month-over-month, the sixth gain in seven months.
One notable negative occurred in real estate: “The output of real estate agents and brokers declined 1.8% in January, as activity in the home resale market was down. Activity in this subsector has generally been declining since its peak in the second quarter of 2016.”
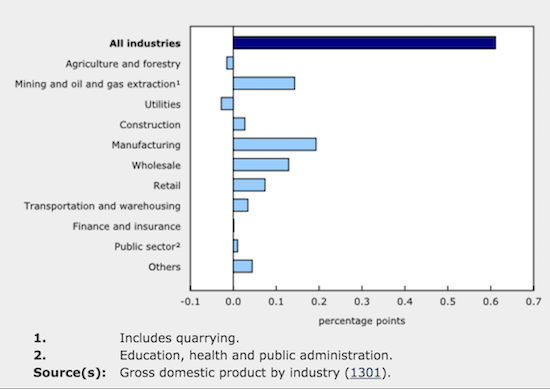
Manufacturing was January’s largest contributor to GDP in Canada.
Given these counter-bear data points, I put a hold on aggressively shorting the Canadian dollar. Indeed, USD/CAD has barely budged for over two weeks since the market spun a dovish interpretation of the Fed’s March rate hike. The 20-day moving average (DMA) has turned downward while the longer-term 50 and 200DMAs are trending upward. I will likely wait to see how these major trend lines get resolved before deciding on any aggressive moves.
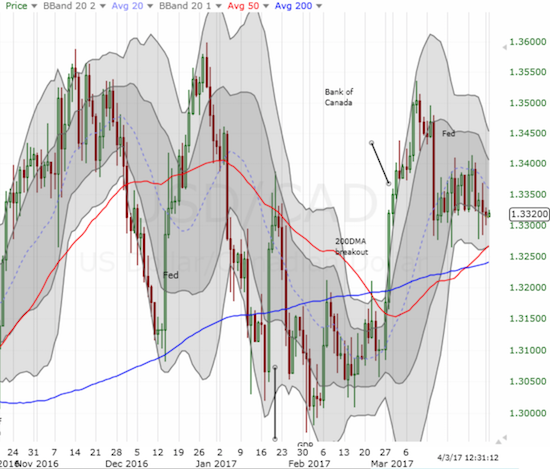
The Canadian dollar is stuck in the muck just below the now downtrending 20DMA of USD/CAD.
The British pound
British Prime Minister Theresa May officially began the Brexit process by triggering Article 50. Speculators remained extremely bearish on the British pound ahead of this event. Net short contracts dropped just 3,769 off the previous week’s historic level of net shorts, the highest since at least 2008. The British pound continued to stay stubbornly strong in the face of the weight of these shorts. I strongly suspect something has to give soon – for now, I am sticking with the bears.
I celebrated when the pound sold-off sharply the day before Article 50 as 200DMA resistance held. I held my short position expecting follow-through only to cringe as GBP/USD found immediate support at its 50DMA. The bounce from there was good for another test of 200DMA resistance. This pinball action will not last of course. With the 20DMA converging with the 50DMA and the 200DMA steadily declining, I suspect the next big move is around the corner. I will have to bail on my current positioning if GBP/USD manages to notch a new short-term high above its 200DMA.
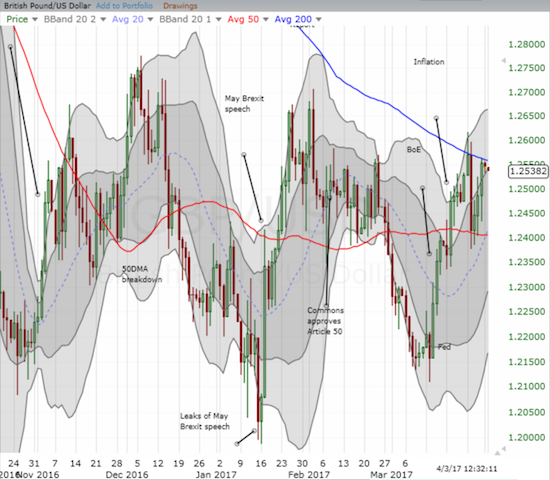
The British pound is struggling with 200 to 50DMA pinball action in a move that has stalled a sharp rally from the last significant low on GBP/USD.
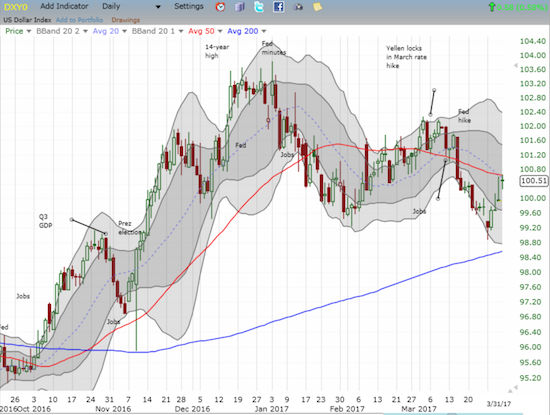
The U.S. dollar index (DXY0) sits in the middle of all these moves. Driven mainly by the euro’s weakness, the U.S. dollar index rallied for the week right into resistance from converged and downtrending 20 and 50DMAs. Since the 14-year high in December, the U.S. dollar has generated a lower high and a lower low.
A true test of 200DMA support seems like the main thing that will resolve whether the dollar resumes strength or slowly but surely sinks away. Strength should support shorting the pound and the Canadian dollar. Weakness should support going long the euro.
The U.S. dollar index rallied with the stock market last week, but it fell short at 20DMA and 50DMA resistance.
Be careful out there!
Full disclosure: short GBP/USD, long EUR/USD

