Since the uncertainty of the elections lifted two weeks ago, the US equity markets have been flying. But the US markets are not the only place where investors are getting a lift. One of those other markets is the Japanese market. The Japanese market is often used as a symbol of economic malaise. The economy has struggled for a long time. And investors don’t forget. Their Nikkei Average hit a high of 22000 in 1996 and has not seem that level since. But that looks to be changing
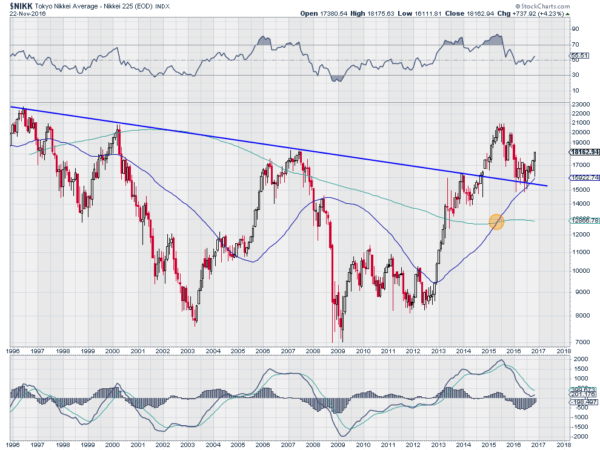
The chart below shows the Nikkei on a monthly timeframe since 1996. And this chart has a lot of good to talk about. The first thing to notice is the Nikkei moved above its 200 month SMA in 2013 and has stayed over it ever since. This is the most rudimentary sign of bullishness. Plus you can see it could not hold over this level the prior two times it got there.
The second item of note is the 50 month SMA coming up and through the 200 month SMA, making a Golden Cross, in 2015. This bullish sign adds to the story. Recently that 50 month SMA has acted as support as buyer showed up when it retraced to that level a few months back.
The momentum story is good too. The RSI is turning back higher. It had retraced to the mid line at 50 and held there, remaining bullish. And the MACD has found a bottom, in positive territory, and is turning back up. With both momentum indicators reset the Nikkei could have a lot of room to run.
The final highlight to note is the falling trend resistance line that has shown importance since the 1996 high. This line stalled the advance in 2000 and 2007. In 2014 though the Nikkei pushed through and continued higher. It made a higher high, over the 2007 high before pulling back. That pullback found support at that prior resistance line, and over the last few months the Nikkei has been moving higher.
The next test for the Nikkei will be at the 2015 high at about 21000, ans then the 22000 level from 1996. A pure technical perspective suggests that neither will play a significant role in arresting the move and that the Nikkei could soar as high as 27000. That is a long way off and much can happen to derail that. But take it for now that the sun is rising over the Japanese market as well.
The information in this blog post represents my own opinions and does not contain a recommendation for any particular security or investment. I or my affiliates may hold positions or other interests in securities mentioned in the Blog, please see my Disclaimer page for my full disclaimer.

