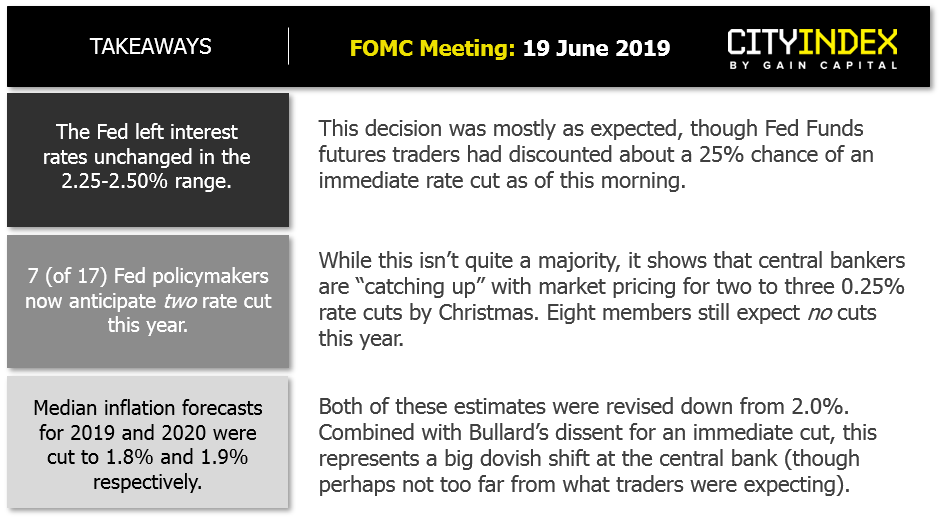
The Fed all but confirmed the U-turn that many were expecting. Whilst rates remained on hold, almost half of voting members now see two rate cuts this year.
Less than two months ago, the Fed was mostly united in saying the US economy was in good shape. Yet at this month’s meeting, the Fed dropped their pledge to be ‘patient’ with the next month and just under half of the voting members now see two rate cut this year.
Trade disputes are the main culprit for this turnaround in a relatively short space of time. It had looked like US and China were on the path to resolving their issues, until negotiations unravelled in May and Washington unleashed a new set of tariffs.
Market Pricing:
- At the time of writing, markets are now pricing in a 71.9% chance of a cut in July, up from 68.5% ahead of the meeting. It’s generally accepted that the Fed likes to see market pricing at or above the 70% threshold before making a change.
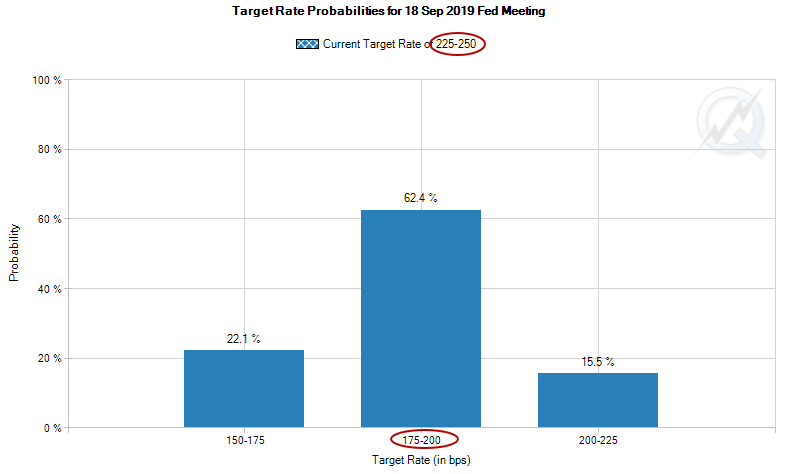
- Expectations for the second cut in September have risen to 62.4%, up from 50.6% ahead of the meeting.
- The probability of a third cut by December stands at 41.2%. We currently see this as an outside chance, so 41.2% could be ‘optimistically’ dovish.
Of course, these expectations will need to be confirmed by Fed action. Failure to do so could see a reversal of current trends, although action will also hinge around trade war developments as a surprise deal following the G20 could see the Fed return to a more neutral stance once more, and markets would have to adjust accordingly.
Market Reaction.
- Yields fell with the US10 year testing 2% in early Asia, its lowest yield since November 2016 (as Trump was elected). The US2 year now yields just 1.73%, its lowest level since November 2017.
- Equities moved higher and remain supported, although upside was fairly limited overall. DJIA and S&P 500 only achieved a marginal new high before settling back inside the prior session’s high.
- Gold broke out (and closed) above $1350 and now trades just shy of $1360, with an intraday high hitting its most bullish level since April 2018.
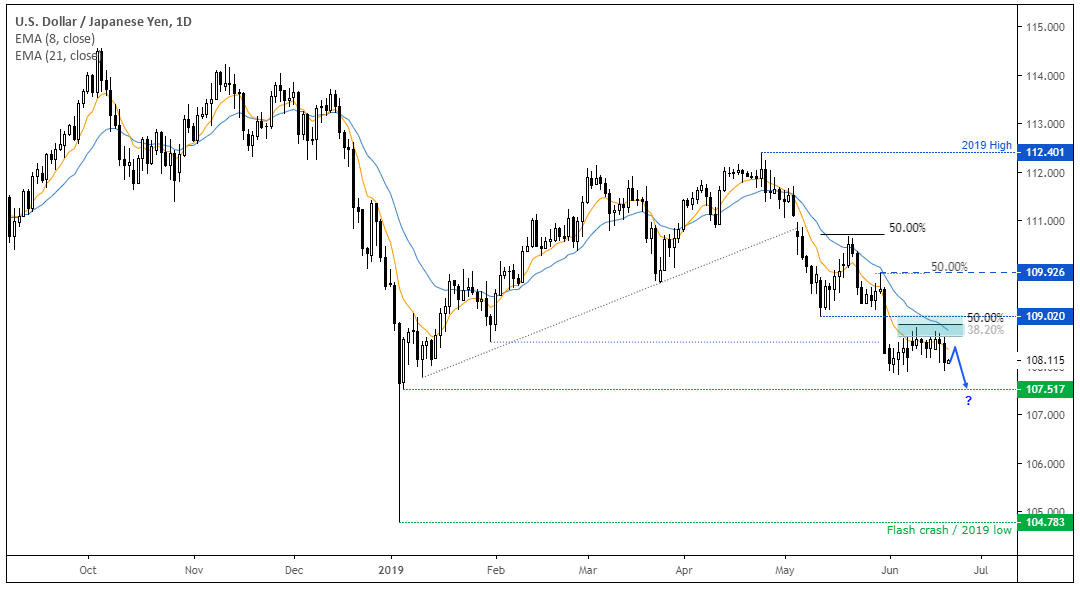
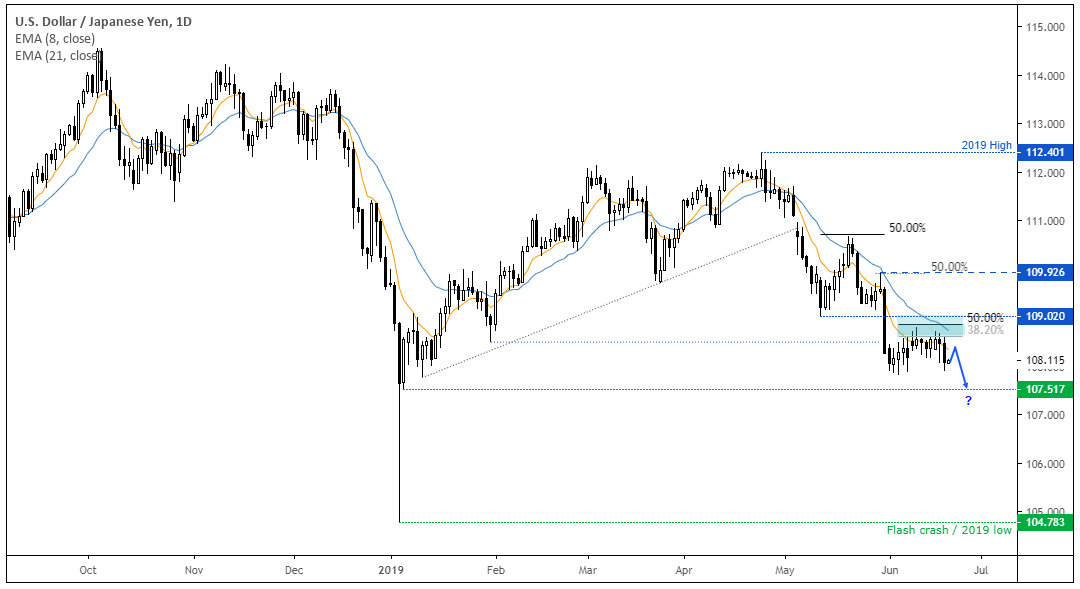
USD/JPY fell to an intraday low of -0.5%, finally settling around -0.35% by the end of the session. This maintains the bearish bias outlined on Tuesday with the resistance zone having performed its job and bearish momentum pointing lower once more. From here we’d expect traders to fade into minor rallies to target 107.51 but, if trade wars are to escalate further then we could be headed much lower.
USD/CHF plummeted 1% at one by and produced a bearish engulfing candle back below parity, finally settling -0.7% by close of play. It had struggled to make headway above parity and found resistance between 1.0000/16 before rolling over. Given the bearish momentum at this likely swing high, the path of least resistance appears to be lower and we’d expect to fade into intraday rallies to target the June low. A break beneath 0.9855 opens-up a run for the 2019 lows.


