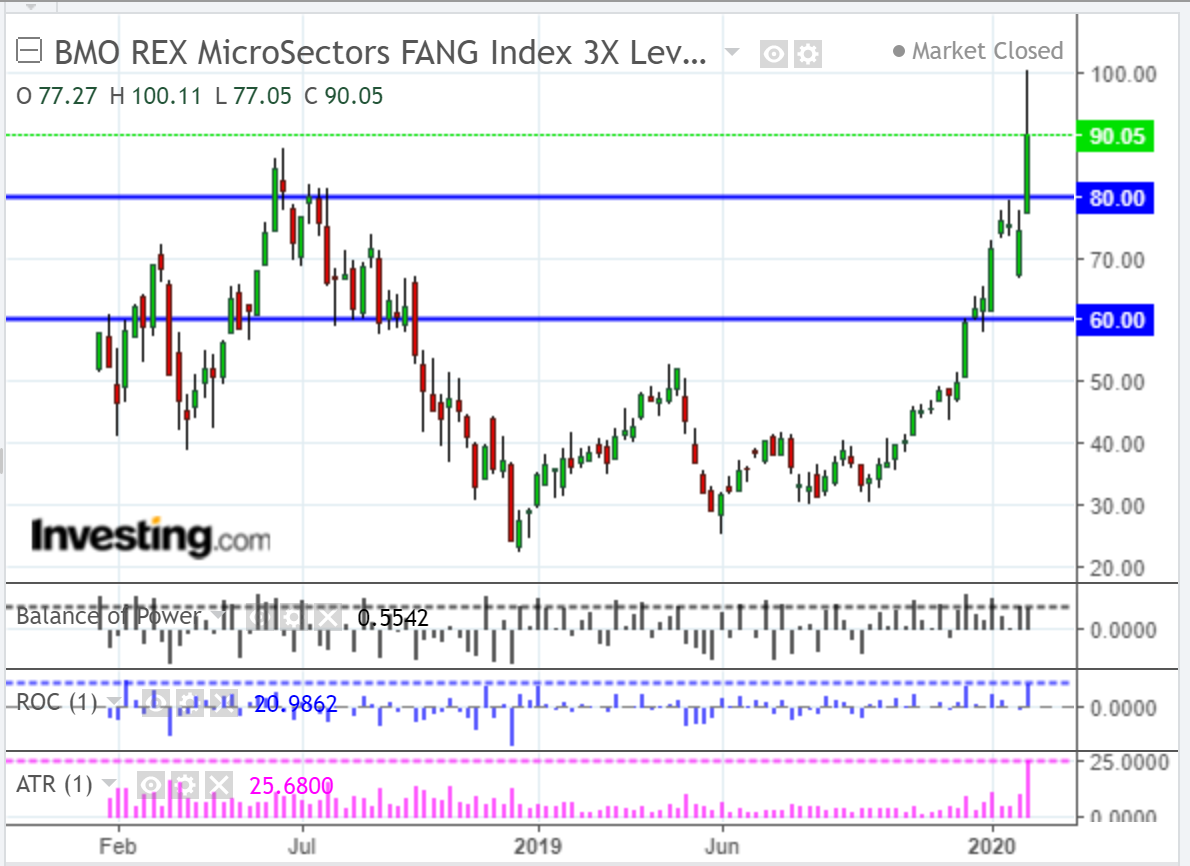
I last wrote about FNGU in my post of late December, 2019.
BMO REX MicroSectors FANG Index 3X Leveraged (NYSE:FNGU) is an exchange-traded note that tracks 3x the daily price movements of an index of U.S.-listed technology and consumer discretionary companies. The index is highly concentrated and equally weighted.
Since then, price blew through both the 78.6% Fibonacci level and its prior all-time high, as shown on the following weekly chart
The Balance of Power still lies in the hands of buyers, in spite of a bit of a blow-off in the last weekly candle. We may not see a trend reversal until this indicator spikes too, and closes on, a new high in one of the coming weeks.
I've shown the input value on both the Rate of Change (ROC) and Average True Range (ATR) technical indicators as one period and both indicators in histogram format.
The ROC on this past week's candle is just below its all-time high (which may be reflective of its blow-off close for the week). No doubt, it may have been at an all-time high when price was at its high of 100.11 on Tuesday.
The ATR spiked to an extreme all-time high this past week.
While the Balance of Power appears to indicate that the buying may not yet be over, the ROC and ATR indicators are hinting at some volatility, choppiness and caution ahead. We may see price attempt to retest last week's all-time high before it, either consolidates in a sideways trend, or drops to near-term support around 80.00, or lower.
However, the NASDAQ Composite Index (IXIC) is only 480 points away from its 10,000 target (as of Friday's close)...a figure I mentioned in my above-referenced post. So, we may see a parabolic spike to that price in short order. If so, we'll likely see FNGU retest 100, or spike higher...before they both, potentially, form blow-off tops.

