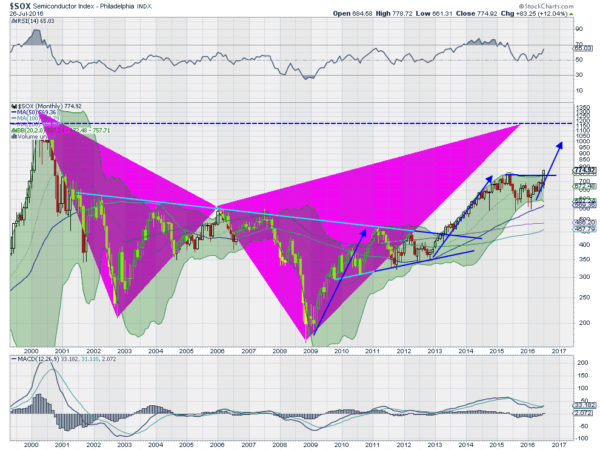
For at least two weeks technology and services names have been topping the proprietary bull scan. So it should come as no surprise when you look at the chart of the Semiconductor Index. It is now overcoming the pullback that started in June last year and launching higher. And there are many indications in the chart that it is just getting started.
Lets start with the price action itself. the last bar in the monthly chart below shows the break above the June 2015 high. It also shows (with 3 trading days left) that the month may close at the high in a long body, Marubozu candle. This is a bullish indicator in itself.
Breaking above the June 2015 high triggers the 3 Drives pattern which gives a target to 1000 on the Index. And then there is a Shark harmonic pattern that carries a Potential Reversal Zone (PRZ) at about 1175.

Momentum indicators are also bullish. The RSI pulled back from a slightly overbought condition to hold at the mid line. For the past 5 months it has been moving back higher in the bullish zone. The MACD also had pulled back. But it held above zero and is turned back higher. This month or next it will cross up, a buy signal. Finally the Bollinger Bands® are opening to the upside after a squeeze.
With all these indications lining up the Semiconductor Index has the potential for a lot of movement higher. Technology stocks may dominate the bull scan for some time to come.
DISCLAIMER: The information in this blog post represents my own opinions and does not contain a recommendation for any particular security or investment. I or my affiliates may hold positions or other interests in securities mentioned in the Blog, please see my Disclaimer page for my full disclaimer.
