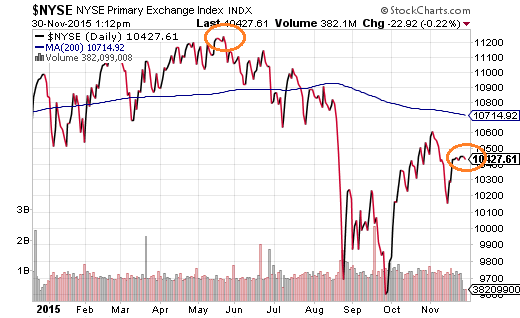
How confident should diversified investors be that U.S. stocks can power ahead without the extraordinary stimulus of quantitative easing (QE) and zero percent interest rate policy (ZIRP)? Not too confident. Stocks that trade on the New York Stock Exchange are down roughly 7.0% from their May highs and down nearly 3.5% since the last QE asset purchase by the Federal Reserve occurred on December 18, 2014.
Some folks are glad to see seven years of extraordinary accommodation come to an end. Consider Andrew Huszar. He is the former Fed official who managed the acquisition of $1 trillion in mortgage-backed debt, then subsequently condemned the endeavor in 2013. Huszar told CNBC, “[QE] pushed up financial asset prices pretty dramatically. A lot of that is the Fed pushing the market’s paper value way above it’s true value.”
Is he wrong? Probably not. Metrics with the strongest correlation to subsequent 10-year returns – Tobin’s Q Ratio, P/E10, market-cap-to-GDP, price-to-sales – all suggest that current valuation levels are at extremes not seen since 2000. Worse yet, if previous cycle extremes are any indication, one should be prepared for a 40%-50% bearish decline for popular benchmarks like the S&P 500.
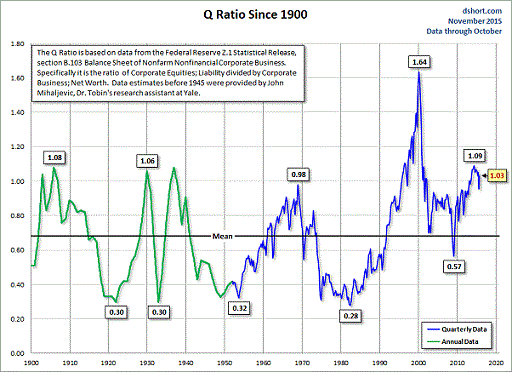
The typical argument against overvaluation – the “this time is different” argument – involves the assumption that unprecedented lows for interest rates render traditional valuation methodologies insignificant. There are at least two problems with this notion. First of all, for rates to stay this low well into the future, it would likely correspond to a feeble U.S. economy as well as anemic corporate revenue. (Corporate sales per share have already declined for three consecutive quarters.) It follows that a deteriorating fundamental backdrop would offset borrowing costs that remain low on a historical basis.
The second trouble with pointing to low interest rates to dismiss overvalued equities? It ignores the directional shift from emergency level QE stimulus to zero percent policy alone to the highly anticipated quarter point tightening. Again, a diversified basket of equally-weighted stocks is down nearly 3.5% since the last QE asset purchase. (Review the NYSE chart above.)
As always, overvaluation doesn’t matter until it does; exceptionally overpriced can become ludicrously overpriced for several years. On the other hand, understanding late-stage bull market phenomena help tactical asset allocators monitor changes in risk-taking. Here are two gauges of “risk off” behavior that I am watching:
1. Flattening Of The Yield Curve
When spreads between longer and shorter treasury bond maturities rise, the yield curve steepens. Investors are less inclined to purchase long-dated treasury debt because they have faith in the strengthening of the economy. In contrast, when spreads fall, the treasury yield curve flattens. Investors demand the perceived safety of longer maturities because they are concerned that economic conditions are deteriorating.
Now consider the current “risk off” behavior. One year ago, the spread between 10-years and 2-years chimed in at 1.8. Today it is roughly 1.3. The 2-year treasury bond yields have soared on the prospect of the Fed’s imminent rate hike, yet the 10-year yield has barely budged because investors are expressing concern about the potential for Fed policy error.
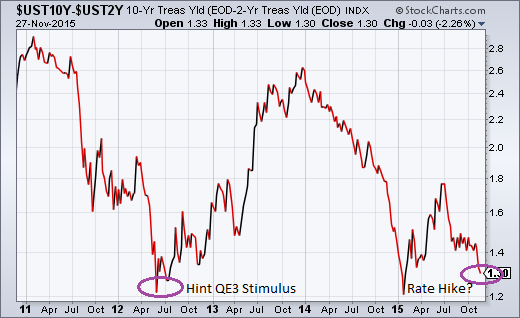
Take a look at what transpired in the middle of 2012. The Federal Reserve met rapidly falling spreads head on, jolting “risk on” investing behavior via open-ended quantitative easing stimulus (QE3). Right now? Investors are exhibiting the kind of “risk off” preferences that transpired back in mid-2012. Yet the Fed is not gearing up to provide additional liquidity. On the contrary. Fed committee members seem resigned to raising borrowing costs, if ever so slightly.
The narrowing between 30-year maturities and 2-years demonstrates a similar “risk off” pattern. The spread is even lower than when the Fed shocked and awed the investing world with QE3.
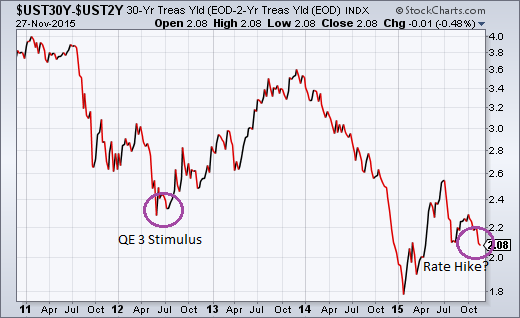
The declining spreads and the flattening of the yield curve are a sign of risk aversion – one that, historically, has worked its way into stocks. If the current pattern of yield curve flattening continues, equity prices of popular benchmarks are likely to fall.
2. Narrowing of Stock Breadth
According to Bespoke Research, the top 1% of Russell 3,000 stocks (30 largest) are up roughly 6.6% YTD. That is the top 1%. The other 99%? The remaining 99% of Russell 3,000 stocks have averaged a decline of -3.0% YTD.
Others have identified the lack of participation using the S&P 500 SPDR Trust (N:SPY). The top 20 components have gained 59% while the other 480 components are collectively down 3.0% YTD. The result for the market-cap weighted ETF? A 3% gain.
Historically, narrow breadth rarely bodes well for the intermediate- to longer-term well-being of market-cap weighted funds. A better picture of what is actually happening to risk preferences is evident in equal-weighted proxies like the Guggenheim Russell 1000 Equal Weight ETF (N:EWRI). We can see that, much like the NYSE itself, EWRI is still close to 7% below its May high; EWRI is still trading at a lower price than when the Fed exited QE for good with its final mortgage-backed bond purchase on 12/18/2014.
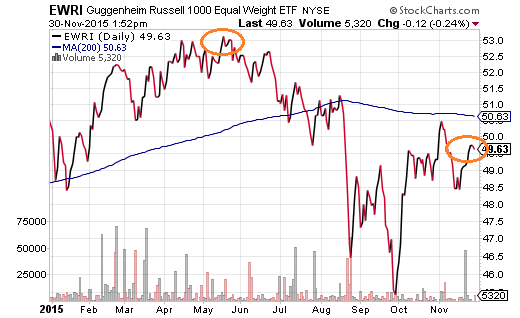
Similar to stock valuations, weak breadth may not matter until it does. Thin leadership where a few stocks carry the entire load can become even thinner leadership. Historically, however, the top 1% or the top 5% tend to buckle. That’s why it is sensible to ask one’s self, is it likely that the other 95% or the other 99% will join the top 1% or top 5% at extremely overvalued price levels? Or is it more likely that profit-taking on stocks like Facebook (O:FB), Amazon (O:AMZN) and Netflix (O:NFLX) will result in a take-down of the heralded S&P 500?
Disclosure: Gary Gordon, MS, CFP is the president of Pacific Park Financial, Inc., a Registered Investment Adviser with the SEC. Gary Gordon, Pacific Park Financial, Inc, and/or its clients may hold positions in the ETFs, mutual funds, and/or any investment asset mentioned above. The commentary does not constitute individualized investment advice. The opinions offered herein are not personalized recommendations to buy, sell or hold securities. At times, issuers of exchange-traded products compensate Pacific Park Financial, Inc. or its subsidiaries for advertising at the ETF Expert web site. ETF Expert content is created independently of any advertising relationships.
