First RBA Tuesday of 2016:
In not a great sign for both the Australian and world economies, yesterday saw the Chinese manufacturing sector expand at its slowest pace in 3 years.
“CNY Manufacturing PMI (49.4 v 49.6 expected)”
With both the primary manufacturing number as well as the second tier non-manufacturing reading both missing market expectations, RBA Governor Stevens and his board will have had a little cringe thinking about future effects that the continued Chinese slowdown will have, but it shouldn’t have changed their thinking about today’s decision.
Keeping rates on hold at 2.00% for another month is all but a sure thing, but the real juice will once again be in the accompanying monetary policy statement. Just how much of an easing bias will the RBA go with?
AUD/USD Daily:
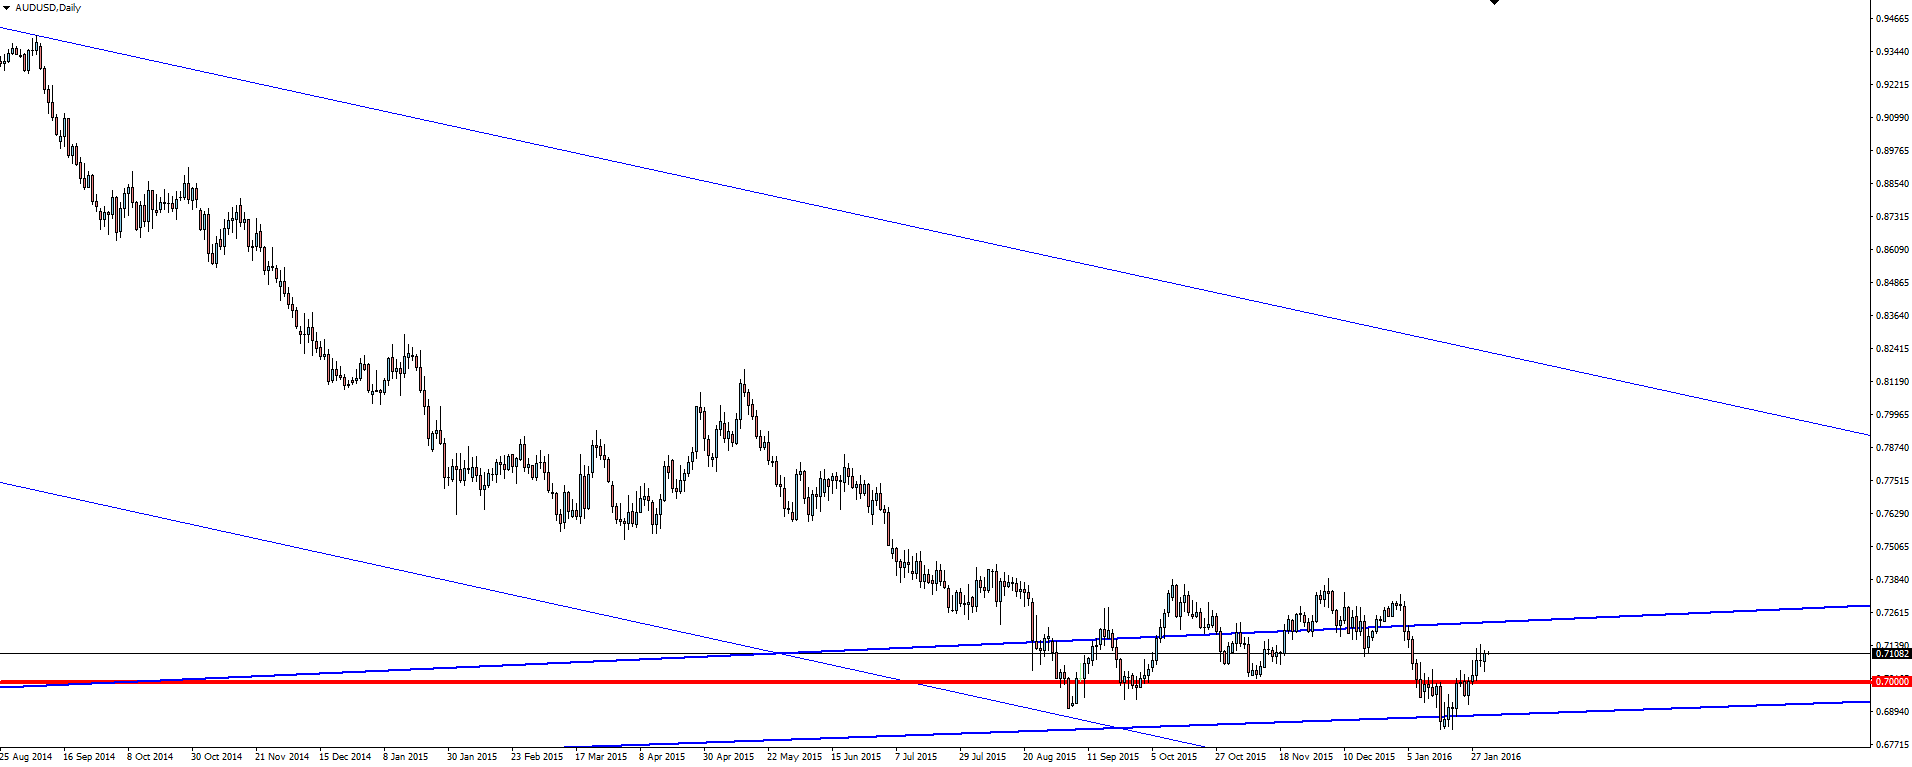
Taking a look at the AUD/USD daily chart, price is well above the 70c psychological level again and bouncing nicely out of the weekly support zone we have been keeping an eye on.
We know that markets are currently pricing in around a 4% chance of a rate cut this week (with just the 1 dissenting economist trying to get his name up in lights no doubt), but by the time we get to July, a ‘final’ cut is fully priced in.
With the market seeming to have all but assured itself that the RBA will sound dovish leading into the middle of 2016 when a cut is expected to come, any disappointment on this front has the potential to see a fairly decent re-pricing in AUD/USD to the upside. We’re at the bottom of a daily range and on weekly trend line support after all. As a trader, this is the most important aspect for you to be considering when you are doing your analysis today.
Chart of the Day:
A few Aussie related charts here today as we head into this afternoon’s RBA decision.
AUD/JPY Daily:
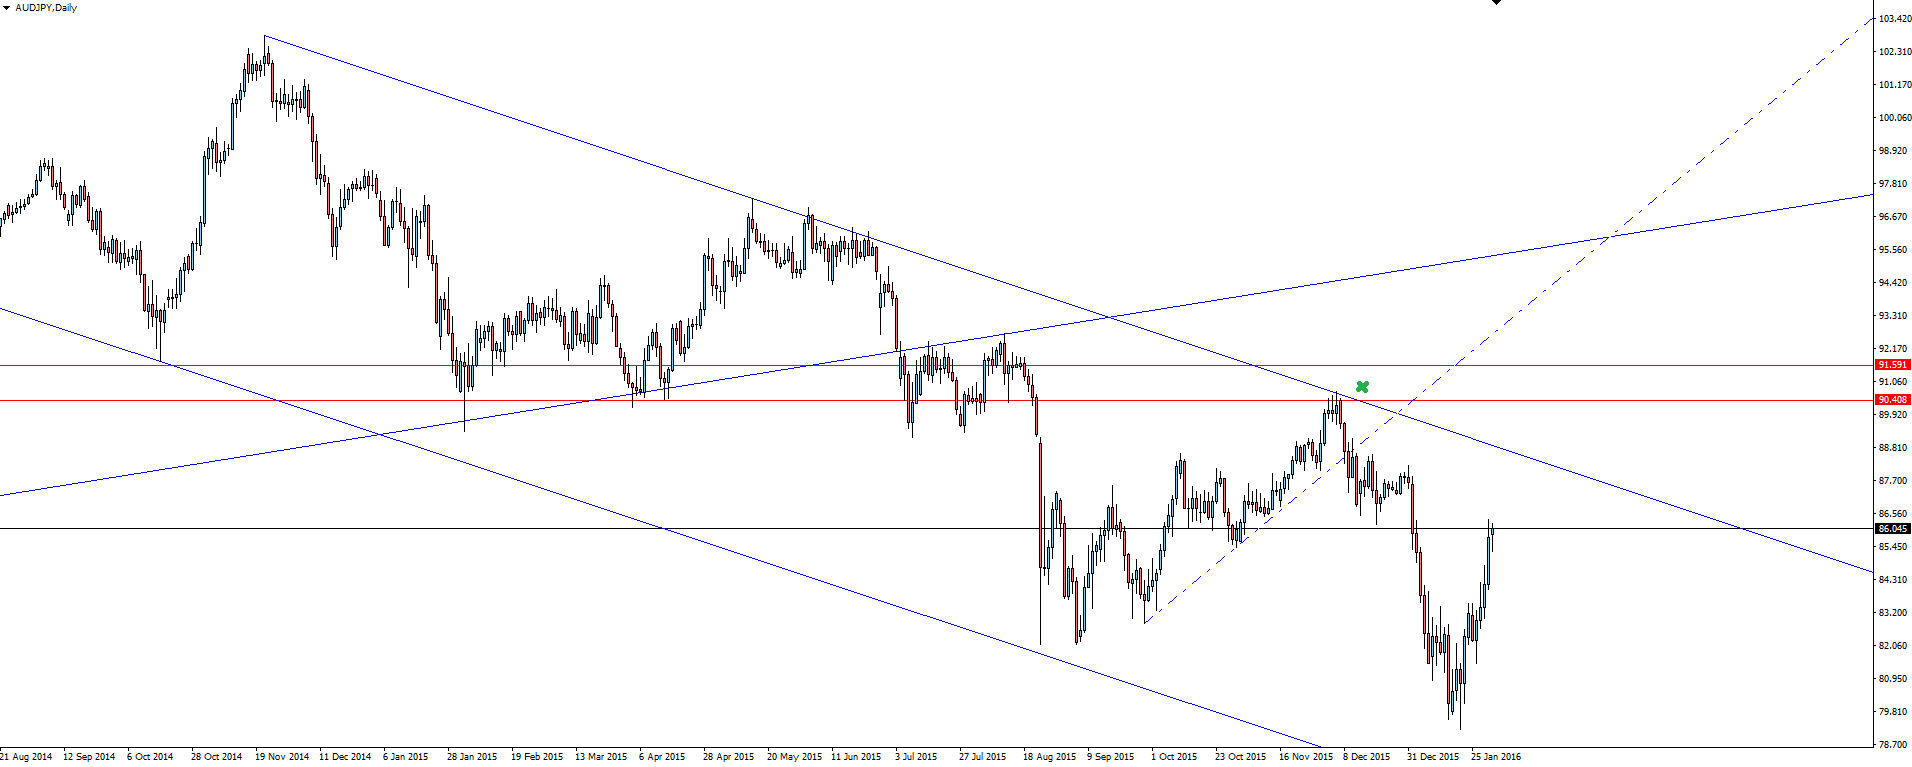
After breaking a major weekly trend line last year, AUD/JPY has been consistently channelling down for a while now. As we spoke about back in December in our last AUD/JPY chart of the day price was at the top of this channel and it was make or break. Well here we are over a month later and the channel is still intact.
Technical analysis!
Bonus Chart of the Day:
S&P/ASX 200 Daily:
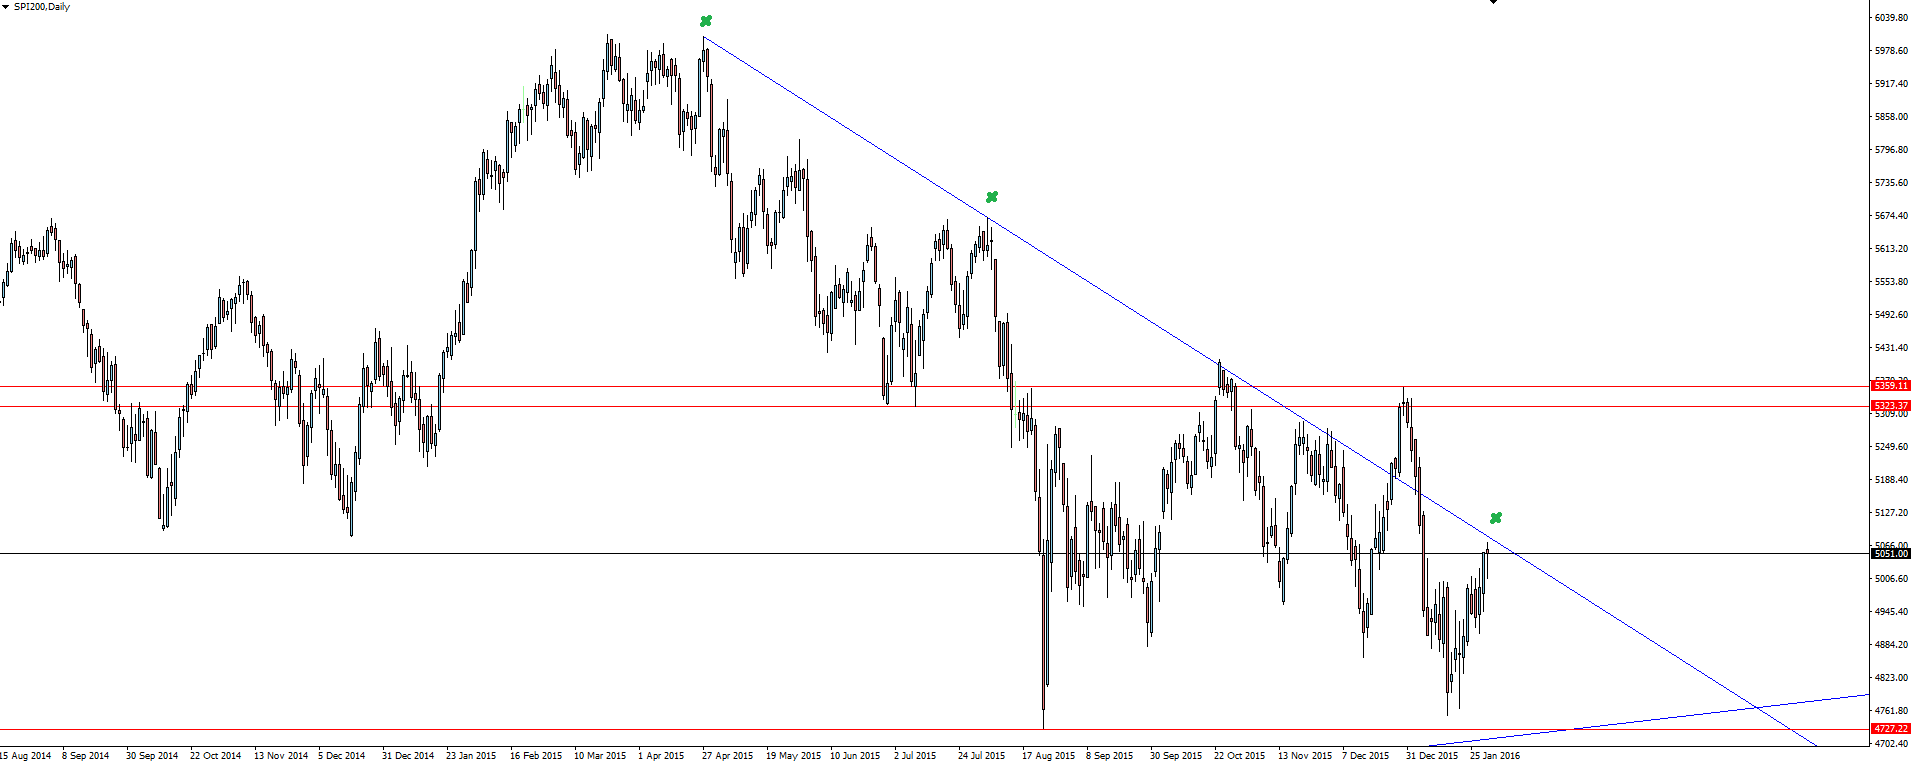
I couldn’t leave the SPI out of today’s morning blog, with price testing short term, counter trend line resistance heading into the decision. As price has coiled up so tightly and we are heading into a major news release, I am not expecting this level to hold or break cleanly, but its worth looking at.
The overall technical pattern on Indices has turned/remained bullish depending on how you treated those weekly trend line support levels we have been speaking about in the technical analysis section of the blog.
I wanted them to break for the potential carnage factor that would have presented plenty of trading opportunities, but it looks like it’s not to be.
On the Calendar Tuesday:
AUD Cash Rate
AUD RBA Rate Statement
GBP Construction PMI
Risk Disclosure: In addition to the website disclaimer below, the material on this page prepared by Forex broker Vantage FX Pty Ltd does not contain a record of our prices or solicitation to trade. All opinions, news, research, tools, prices or other information is provided as general market commentary and marketing communication – not as investment advice. Consequently any person acting on it does so entirely at their own risk. The experts writers express their personal opinions and will not assume any responsibility whatsoever for the actions of the reader. We always aim for maximum accuracy and timeliness, and Australian Forex broker Vantage FX shall not be liable for any loss or damage, consequential or otherwise, which may arise from the use or reliance on this service and its content, inaccurate information or typos. No representation is being made that any results discussed within the report will be achieved, and past performance is not indicative of future performance.
