The first look at Q2 ’18 GDP will be Friday morning, July 27th, 2018 and expectations have risen sharply throughout the quarter. Some think Q2 ’18 GDP could hit 4% – 5%, but the prognosticators don’t really provide where the additional higher growth is coming from.
Retail Sales saw sharply higher revisions the last two reports, although some of that could have been revisions to Q1 ’18 data, i.e. March Retail Sales.
The basic formula for GDP is C + I + G + (exports – imports).
- C = Consumption, a big part of which is Retail Sales. Consumption is roughly 2/3rd’s of total GDP.
- I = Investment, which is Business Investment, Residential Construction and changes to Inventories. Readers might often see a GDP figure quoted “ex-inventory” which removes the inventory adjustment from the final GDP number. I believe it’s the “Real Final Sales” GDP that is inflation-adjusted and inventory-adjusted although to be frank with readers it’s been a while since it mattered.
- G = government spending.
- Exports – imports = the trade deficit.
The above is greatly oversimplified for readers but at least gives some idea of the GDP template.
The bug in the interest rate bear’s portfolio positioning the last few years is that there just isn’t any real change to the rate of inflation increase. It isn’t that the various inflation gauges aren’t moving higher – they are – but it is happening in a steady, methodical, PREDICTABLE fashion. What really gets the bond vigilante’s juices flowing and rates rising is when the bond market sees “unanticipated inflation.”
While the 10-year Treasury yield jumped from 2.83% to 2.89% last week, the slightly hotter CPI and PPI inflation data from two weeks prior, didn’t budge Treasuries at all. As of the last month or two, the actual core inflation rate that the Fed has been targeting and worried about with fed funds rate increases up to the 2%, is here now.
It’s arrived. And the Treasury market is completely bored with it.
With Friday’s GDP number, bond investors also get the first look at the GDP deflator, which may not carry the same weight that the PCE (personal consumption expenditure) deflator carries with the Fed, but the deflators are thought to carry more weight with the bond markets since these price indices aren’t “fixed-weight” and are adjusted for changes in consumer purchasing behavior over time.
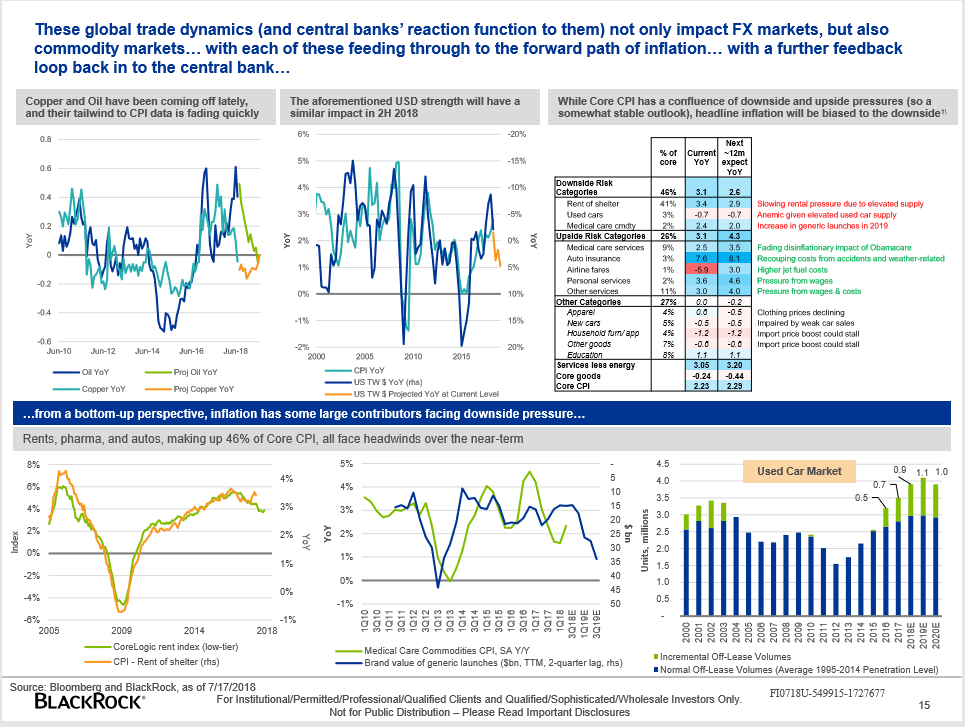
I had a chance to listen to Blackrock’s Rick Reider’s conference call to bond investors last week, and his presentation had an interesting graph on the forward prospects for inflation:

Note the bottom three graphs from the presentation: the data shows that for roughly 40% of the CPI components, “inflation” could be flat to lower over the coming months.
Rick Reider spoke to the CFA Society of Chicago after the 2008 Financial Crisis and i still use a couple of his points on Financial System leverage, although I probably need an update on that topic. BlackRock’s research is outstanding, and usually a must read.
Conclusion: Jeff Gundlach said last week that he thinks the 10-year Treasury could trade down to 2.65%, and BlackRock’s Rick Reider thinks the CPI could be pulled lower over the next few months as 40% of the CPI components see disinflation or deflation. The record low in jobless claims of 207,000 is just stunning to me, but the Treasury market’s reaction to that data is an indication that Treasuries aren’t much worried about wage inflation either.
If you don’t think GDP data is still important note that the January 26th market peak for the S&P 500 came two days prior to the Q4 ’17 Advance GDP release, and a 10% correction in the main benchmark quickly followed.
The bond market has gone to sleep on inflation, and for good reason.
However bond markets have a habit of surprising investors.
Thanks for reading.
(Clients' bond allocations have changed little in the last 6 – 12 months, but if the 10-year and 30-year Treasury yields don’t rise on stronger GDP data, the Treasury short (TBF) may be sold).
